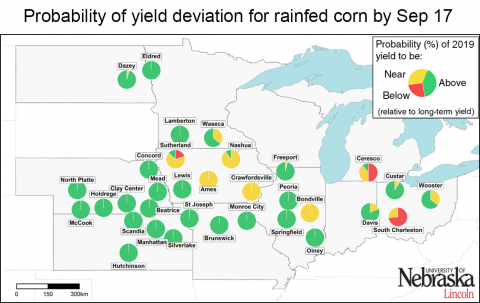
2019 Corn Yield Forecasts as of September 17
September 19, 2019
Forecasted end-of-season yields for rainfed corn across the Corn Belt indicate above-average yield at two-thirds of the sites, with yields well above historical averages in Nebraska, Kansas, and Missouri. See data for individual irrigated and rainfed sites.
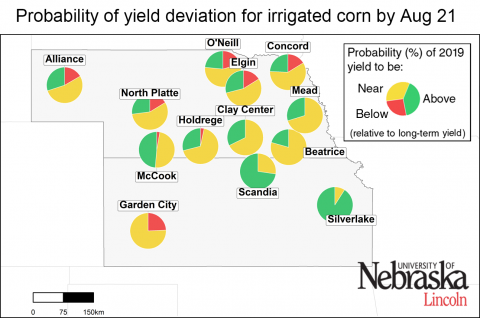
2019 Corn Yield Forecasts as of August 21
August 22, 2019
There is a high probability of near- or above-average yields at all but two of the 37 locations studied. Corn has reached dough stage at most locations, except for irrigated corn in western and north-central Nebraska, northern North Dakota and Minnesota, and the eastern fringe of the region (Indiana, Michigan, and Ohio).
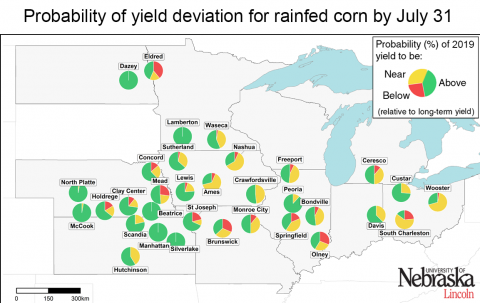
2019 Corn Yield Forecasts as of July 31
August 2, 2019
This article summarizes the simulated crop stages and yield forecasts performed on July 31 for 37 locations across the US Corn Belt.
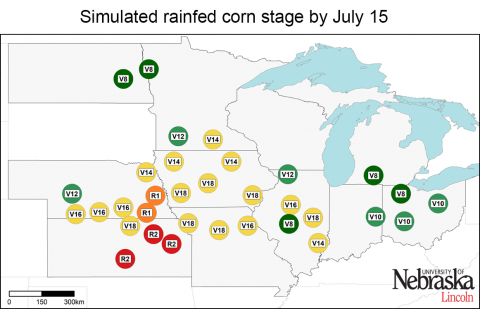
2019 Corn Yield Forecasts as of July 15
July 19, 2019
Corn is still in vegetative stages across much of the Corn Belt. At this point, delayed planting doesn't appear to have affected yields at irrigated sites. Yields for rainfed sites vary considerably, with those on the western edge trending above normal.

2019 Corn Yield Forecasts: Approach and Interpretation of Results
July 8, 2019
Agronomists address how the Corn Yield Forecast Center develops yield forecasts, what to expect during the growing season, and how to use the forecasts to inform farm decisions. Tables detailing soil types and crop management for each of the 41 locations are included.