Patricio Grassini, Associate Professor of Agronomy and Horticulture, Extension Cropping System Specialist and Water for Food Institute Fellow; Jose Andrade, UNL Research Assistant Professor of Agronomy and Horticulture; Juan Ignacio Rattalino Edreira, Research Assistant Professor; Gonzalo Rizzo, UNL Ph.D. Student; Haishun Yang, Associate Professor of Agronomy and Horticulture and Water for Food Institute Fellow; Keith Glewen, Extension Educator, and Jennifer Rees, Extension Educator; Jeff Coulter, Professor and Extension Specialist, University of Minnesota; Mark Licht, Extension Cropping System Agronomist, and Sotirios Archontoulis, Assistant Professor, both at Iowa State University; Ignacio Ciampitti, Crop Production and Cropping System Specialist and Assistant Professor of Agronomy, Kansas State University; Ray Massey, Extension Professor, University of Missouri; Peter Thomison, Extension Specialist and Professor, Ohio State University

Simulations of 2019 end-of-season corn yield potential and real-time crop stage were performed on July 15 for 37 locations across the US Corn Belt using the UNL Hybrid-Maize crop model in collaboration with faculty and extension educators from 10 universities. This article summarizes the simulated crop stages and yield forecasts; the data can be viewed here. Details on the UNL Hybrid-Maize crop model and the underpinning methodology to simulate phenology and forecast end-of-season yields, as well as on interpretation and uses of yield forecasts, are described in a previous article. Note that one location in Iowa (Kanawha) and three locations in Indiana (Butlerville, Columbia City, and West Lafayette) were not included in the forecasts this year due to lack of weather data.
A summary of weather conditions during the last 60 days (May 16 to July 15) is shown in Figure 1. The season started with temperatures near normal throughout the Corn Belt. In contrast, rainfall was above normal in most of the locations.
Simulated Corn Stage across 37 Locations
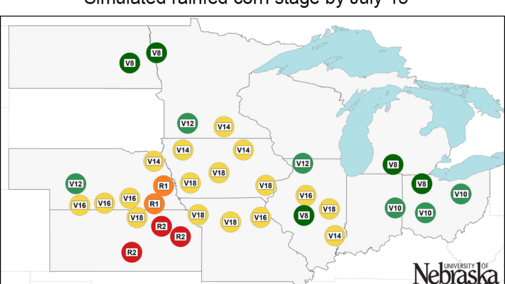
Corn is still in the vegetative stage in most parts of the Corn Belt, except for east Kansas and southeast Nebraska where corn has reached silking. Sites in the northern and eastern fringes of the region (North Dakota, Michigan, Ohio, and Indiana) are well behind the rest of the locations (Figure 2). All locations are running behind last year’s corn development.


Figure 2. Simulated developmental stage for irrigated and rainfed corn at each location. Vn: vegetative stage (nth leaf); R1: silking; R2: blister; R3: milk; R4: dough. Separate maps are shown for irrigated corn and rainfed corn.
Irrigated Corn: Uncertain Yields
The range of forecasted irrigated corn yield potential for each location, as well as the probabilities for yields above, near, or below average, are shown in Figures 3 and 4. It is still too early to visualize clear trends. Interestingly, at most sites, there is no clear indication that the late planting this year by itself set a high probability of low yield from the get-go. Weather conditions during the rest of July and August will provide a clearer indication of this year’s expected yield.


Figure 3. Vertical lines indicate the range of forecasted 2019 corn yield potential by July 15 based on average planting date in 2019 at each location. Horizontal lines indicate the 25th and 75th percentiles of the yield distribution (associated with respective adverse and favorable weather scenarios during the rest of the season). The blue squares indicates the long-term (2005-2018) average yield potential at each location. Separate charts are shown for irrigated corn and rainfed corn.
Rainfed Corn: Low Probability of Below-Average Yields in 2019
Forecasted yield potential is highly variable across rainfed sites (Figures 3 and 4). There is a high probability of above-average yield (>75%, that is, a chance of 3 out of 4) at nine sites in western and central Nebraska, northeastern Kansas, eastern North Dakota, southwestern Minnesota, and central Illinois. In contrast, at this point of the season, there are no sites with high probability of below-average yield across the US Corn Belt, but this may change depending on precipitation and temperature during the rest of July and August.


Figure 4. Probability of the 2019 yield potential to be below (10%, green color) the long-term (2005-2018) average yield potential at each location. Separate maps are shown for irrigated corn (top) and rainfed corn (bottom). The larger a color section is within the pie chart, the higher the probability that end-of-season corn yield will be in that category. Average forecasted yield potential for each site is indicated inside each pie chart (bushels per acre).
Conclusions
Corn is still in vegetative stages throughout most of the region. Although it is still too early to make strong inferences about end-of-season yields for irrigated corn but, at least, we don’t see a high probability of lower yields due to late planting. This can change depending upon temperature during the next four weeks. For rainfed corn, the scenario is diverse across regions, with above-average yields in the western fringe of the region. Temperature and rainfall during the rest of July and early Aug will likely determine the trend for the other rainfed sites.
These forecasts do not take into consideration problems with stand emergence, hail/flooding damage, replanting situations, disease, or nitrate leaching. In fields negatively affected by these constraints, actual yields will be lower than estimates provided here. It is important to keep in mind that yield forecasts are not field specific and, instead, represent an estimate of average on-farm yield for a given location and surrounding area in absence of the yield-reducing factors mentioned here. Likewise, crop stages and forecasted yields will deviate from the ones reported here in fields with planting dates or hybrid maturities that differ markedly from those used as the basis for the forecasts. We will follow up with further forecasts in early August.
