2016 Corn Yield Forecasts as of July 13
July 14, 2016
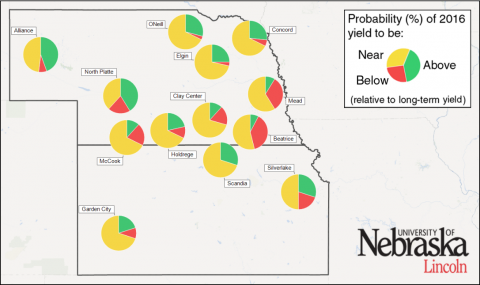
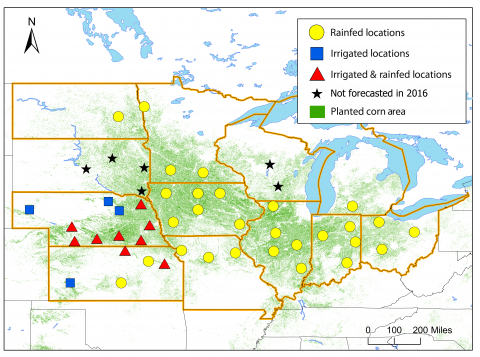
Based on modeling corn growth stage and end-of-season yield for 41 sites in 10 Corn Belt states, researchers are forecasting potential end-of-season yield in "real time" to aid in decision-making thoughout the season. On July 14 they reported that corn has already reached or is approaching silking throughout most of Nebraska and the Corn Belt, except for corn in the northern and eastern states, where growth is running behind the rest of the region.based on modeling end-of-season corn yield for 41 sites. There is a low (<20%) probability of below-average yields at all irrigated locations, except for two sites in southeastern Nebraska. The range of forecast yields at the rainfed sites is wider. There is a relatively high probability (>75%) of above-average yield at two locations in the northern states and below-average yield at three locations. See story for predicted yields and probabilities for all the sites.
2016 Corn Yield Forecasts: Approach and Interpretation of Results
June 30, 2016
The Yield Forecasting Center will be providing in-season corn yield forecasts every two weeks starting in mid-July to aid growers and the ag industry in making management, logistics, and marketing decisions through the season. The Center consists of a core team at UNL in collaboration with agronomists and extension educators from universities throughout the Corn Belt.
Managing N in a Wet Spring
May 5, 2016
USDA NASS estimated 26% of Nebraska’s corn acres had been planted as of May 2, well behind last year’s pace of 45% and slightly behind the five-year average of 31%. The pace is undoubtedly being affected by the amount of precipitation across the state and the wet field conditions (Figures 1 and 2).

