

(Top) A field approaching silking (R1) near O’Neill. (Bottom) A field that has already reached silking near Mead. (Photos courtesy of Nicolas Cafaro La Menza and Agustina Diale; taken on July 14, 2016.)
The season started with high temperatures and dry conditions during June. However, rainfall during July improved soil water status. A summary of the weather conditions during the last 30 days (June 13-July 13) is shown in Figure 1.
To evaluate, in “real-time,” the impact of this season’s weather on corn yield potential and its spatial variability across the Corn Belt, simulations of 2016 end-of-season corn yield potential and real-time crop stage were performed on July 13 for 41 locations using the UNL Hybrid-Maize model in collaboration with faculty and extension educators from 10 universities. This article summarizes these simulated crop stages and corn yield forecasts. Details about Hybrid-Maize and the underpinning methodology to forecast end-of-season yields, as well as interpretation and uses of yield forecasts, is described in a July 1 CropWatch article.

Figure 1. Daily solar radiation, maximum and minimum air temperature (Tmax and Tmin), total rainfall, and total reference grass-based evapotranspiration (ET) for June 13 - July 13. Vertical bars indicate the range for these variables based on more than 20 years of weather records. The horizontal thick black line indicates the long-term average and the red dots indicate the 2016 values.
Simulated Corn Growth Stage across 41 Locations
Corn has already reached or is approaching silking throughout most of Nebraska and the Corn Belt, except for corn in the northern and eastern states, where growth is running behind the rest of the region (Figure 2).

Figure 2. Simulated crop stage for irrigated and rainfed corn at each location. Vn: vegetative stage (nth leaf); R1: silking; R2: blister; R3: milk; R4: dough; R5: dent; R6: physiological maturity (“black layer”). Separate maps are shown for irrigated and rainfed corn.

Irrigated Corn: Low Probability of Below-Average Yield
The range of forecasted irrigated corn yields for each location, as well as the probabilities for yields above, near or below average, are shown in Figures 3 and 4. The range of forecasted irrigated yields is wide and includes the long-term average yield at all irrigated sites (Figure 3). There is a low (Figure 4). However, it is too early in the growing season to tell if forecasted irrigated yields will remain near or above long-term average yields.
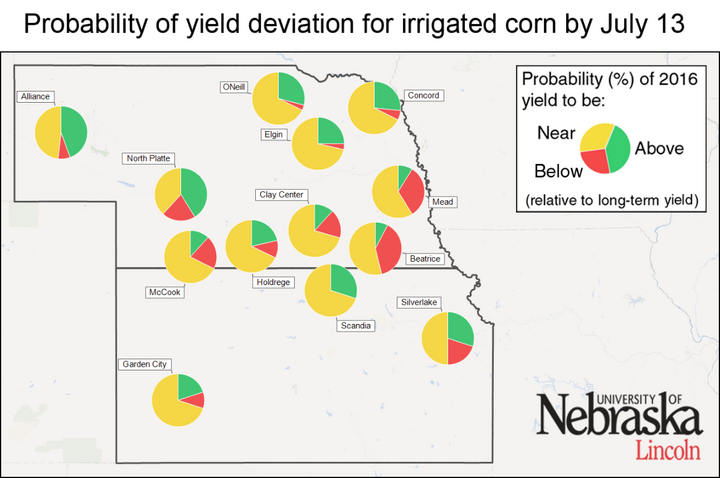
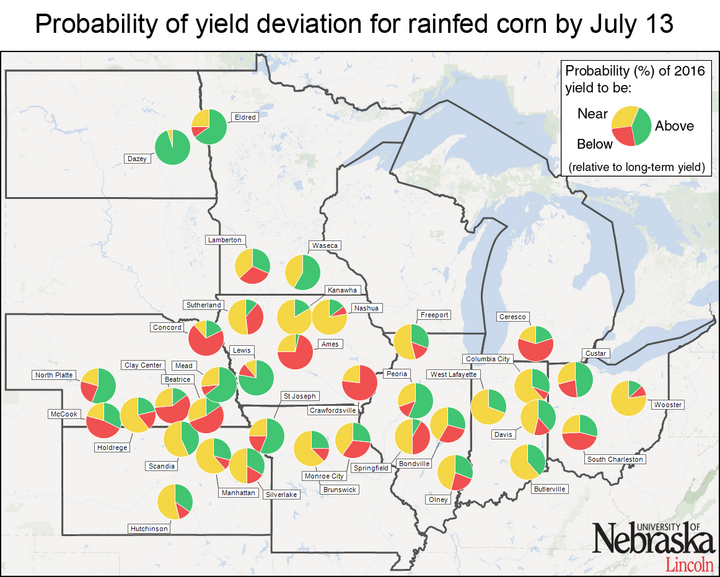
Figure 4. Probability of obtaining a 2016 yield below (≤10%, red color), near (±10%, yellow color), and above (>10%, green color) the long-term (2005-2014) average at each location. The larger a color section is within the pie chart, the higher the probability that corn yield will be in that category. Separate maps are shown for irrigated corn (top) and rainfed corn (bottom).


Rainfed Corn: High Uncertainty across Locations
For rainfed corn, the range of forecasted yields is wide (Figure 3). There is a relatively high probability (>75%) of above-average yield at two locations in the northern states (North Dakota and Minnesota) and below-average yield at three locations (Concord and two sites in central and southeastern Iowa) (Figure 4). The scenario is less clear across the other 32 rainfed sites.
Conclusions
The range of forecasted irrigated and rainfed yields is wide; hence, these early forecasts should be taken with caution. Growing conditions up to now indicate low probability of below average yields at most irrigated sites. End-of-season yields are more uncertain for rainfed sites. These forecasts do not take into consideration problems with stand emergence, hail/flood damage, replanting situations, disease, or nitrate leaching and, therefore, in fields negatively affected by these constraints, actual yields will be lower than these estimates.
It is important to keep in mind that the yield forecasts are not field specific and, instead, represent an estimate of average on-farm yield for a given location and surrounding area in absence of the yield-reducing factors mentioned here. We will follow up with further forecasts in late July.


