2019 Corn Yield Forecasts as of July 15
July 19, 2019
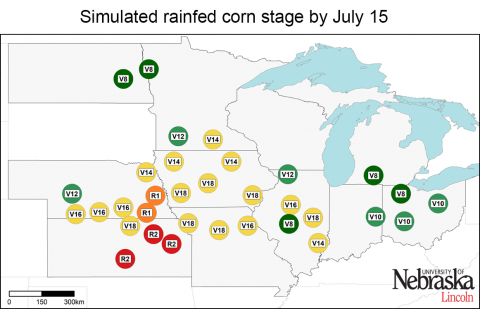
Corn is still in vegetative stages across much of the Corn Belt. At this point, delayed planting doesn't appear to have affected yields at irrigated sites. Yields for rainfed sites vary considerably, with those on the western edge trending above normal.

2019 Corn Yield Forecasts: Approach and Interpretation of Results
July 8, 2019
Agronomists address how the Corn Yield Forecast Center develops yield forecasts, what to expect during the growing season, and how to use the forecasts to inform farm decisions. Tables detailing soil types and crop management for each of the 41 locations are included.
 USDA-National Agricultural Statistics Service (NASS), National Cultivated Layer).")
Major Causes of Soybean Yield Gaps in Nebraska and 9 Other States Identified
April 15, 2019
A four year study in Nebraska and other north central states found that planting date was a leading factor explaining the gap between current soybean yield and potential yield. The gap ranged from 11% in irrigated fields in south-central Nebraska to 21% in dryland fields in eastern Nebraska.