Detailed information about survey findings for Nebraska and the other nine surveyed states can be found in Benchmarking Soybean Production Systems in the North Central US.
For the past three years, researchers from the University of Nebraska-Lincoln and University of Wisconsin-Madison collected survey data from producer soybean fields planted in four growing seasons (2014-2017) in Nebraska and nine other states in the North Central region (WI, MI, IN, IL, IA, ND, OH, KS, and MN). The work was led by Associate Professor of Agronomy and Cropping System Specialist Patricio Grassini (UNL) and Professor of Agronomy and State Soybean and Small Grain Specialist Shawn Conley (UW) and supported by the North-Central Soybean Research Program (NCSRP), the Nebraska Soybean Board, and the Wisconsin Soybean Marketing Board.
The goal of the project was to identify key management practices explaining the gap between current yield and yield potential as determined by climate, soil, and genetics. This information can help producers understand what factors are preventing them from fully realizing the potential of their soybean fields and fine-tune their current management to increase yield and profit.
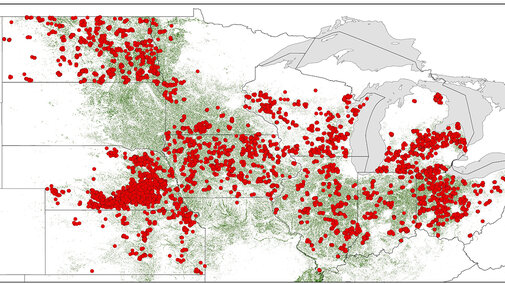
The UNL-WU team collected data on soybean yield and management practices from 9,133 fields across the north-central US (Figure 1), including 2,447 Nebraska fields (irrigated and dryland). UNL researchers partnered with Nebraska Extension and the Nebraska Natural Resources Districts (NRDs) to reach out to producers to take the surveys. We especially want to thank the many Nebraska farmers for the time they devoted to taking our surveys.

Major Findings
Help Reduce the Gap
If you would like to participate in an on-farm study of practices affecting the soybean yield gap in Nebraska, see this CW article for more information.
First, we found that the average yield gap (the difference between potential and current yield) in Nebraska ranged from 11% in irrigated fields in south-central Nebraska to 21% in dryland fields in eastern Nebraska.
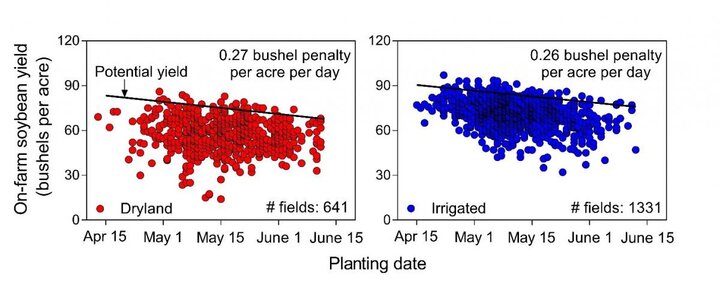
Second, we found that planting date is the most consistent management factor explaining the current yield gap. Delay in planting date after late April leads to a yield penalty of about 1/4 bushel per acre per day in both dryland and irrigated fields (Figure 2). Foliar fungicide application and tillage were other practices explaining the yield gap.

