Projecting Dates for Ending Reproductive Stages of a Soybean Crop Using SoyWater
Background
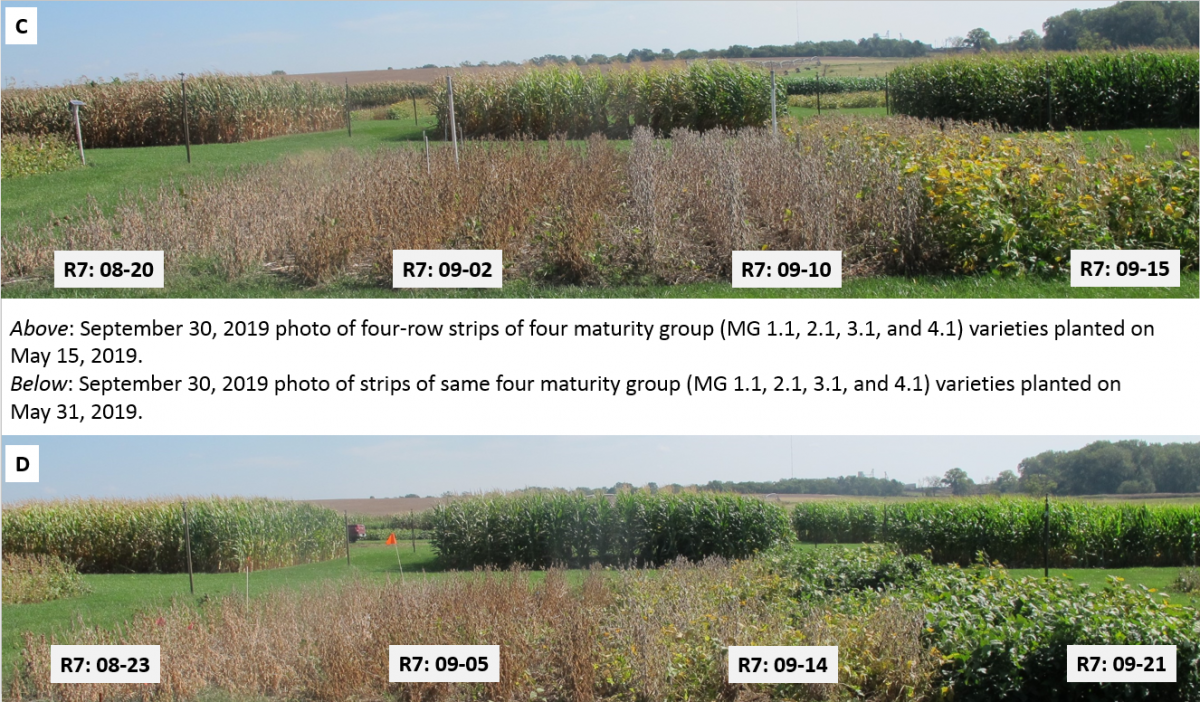
Soybean plots planted for the August 23 Soybean Crop Diagnostic Clinic near Mead are now demonstrating the effects of planting date and maturity group on the timing of late reproductive stages.
One field demonstration at the Eastern Nebraska Research and Extension Center (ENREC) involved planting four-row strips of four soybean varieties differing by one unit in maturity group (i.e., MGs of 1.1, 2.1, 3.1, and 4.1) on four planting dates. Planting dates were approximately two weeks apart: April 17, April 30, May 15, and May 31. Each of the four planting dates for the irrigated demonstration plots was photographed on September 30, 2019. (See Figure 1 panels A, B, C, and D.) The SoyWater (SoySim) projections of R7 calendar dates for each of the four MG varieties are shown in each photo.
Key Points
- SoyWater projections of vegetative (Vn) and reproductive (Rn) dates were used to track soybean crop progress in demonstration plots planted on different dates with different maturity group varieties.
- As expected, main stem vegetative nodal accrual displayed a tri-phasic (S-shaped) time pattern that was linear from V1 to the Vn coincident with R5 (MG-specific).
- Lack of water stress and hot temperatures in August 2019 created mild growing conditions that led to a later-than-expected date of R7 (physiological maturity-PM).
- For late-planted soybean (after May 31 and as late as July 15) to attain R7 before a normal frost/freeze date, producers need to use varieties with an earlier MG.
Late-season high temperatures and water deficits typically hasten the date of the R5, R6, and R7 reproductive stages, but in 2019, the mild late-season temperatures coupled with the lack of any water stress led to a longer-than-expected crop reproductive period. As a result, the observed in-field 2019 dates of R7 in the one-replicate demonstration plots of MG 1.1, 2.1, 3.1, and 4.1 were judged to be approximately 2, 4, 6, and 8 days later, respectively, than the SoyWater-predicted dates of R7 in each of the four planting date plots. Indeed, with the May 31 planting date, the MG 4.1 variety (lower right side of figure panel D) attained an R7 (plant-based one mature pod) status only a day before the September 30 photograph.
-

Figure 1, panels A, B and C, D. The four panels depict the soybean crop development status on September 30 for the four varieties, differing by 1.0 unit in maturity group (MG), in four demonstration plots at the Eastern Nebraska Research and Education Center near Mead. Planting dates (PD) were about two weeks apart from mid-April to late May.
-
Comparing Crop Stages of 4 Maturities and 4 Planting Dates
The SoyWater (SoySim) projected calendar dates for VE (emergence), V1 (when the 1st trifoliolate leaflets have just unfolded), and for each of the seven R1 to R7 stages are presented in Table 1 (below). The number of days between these stages: PD to VE (or V1), V1 to R1, R1 to each subsequent Rn, and V1 to R7 are presented in Table 2 (below). This table provides readers with a timeframe that focuses on “days,” rather than the “dates” used in Table 1. This is useful for evaluating the impact on crop development in the 16 combinations of 4 PD X 4 MG factors.
When planted on the same date in the same field, varietal MG is irrelevant in that it has no impact on the dates of VE or V1. When soybean plants attain the V0-V1 stage, the unifoliolate leaves will begin to sense the night length (i.e., number of hours from dusk to dawn). If the night period is long enough, those leaves will transmit a florigen signal to all florigen-responsive vegetative meristems that have formed at the base of each nodal leaf primordia present at the stem tip.
Relative to the latitude of this Nebraska test site, the degree of photo-period induction that occurs at V0-V1, and thus the strength of the transmitted floral signal, will be strong for the MG 1.1 variety but weaker for the MG 4.1 variety. This will result in an earlier R1 date in the former variety and a later R1 date in the latter variety (see the R1 date column in Table 1).
The number of days from PD to VE, from VE to R1, and from R1 to each of the subsequent Rn stages is documented in Table 2. Although the seed in the April 17 planting date commenced germination that same day, the resulting seedlings took 24 days to emerge. Conversely, in the case of the May 31 planting date, the resulting seedlings took only six days to emerge. This four-fold difference in days to reach VE indicates that in early plantings, good quality seed must be used given that the seeds can be below the soil surface for several weeks, in this case, three weeks, after planting. Note that fungicide-treated seed was used for all four varieties planted in this demonstration.
The planting date-to-V1 interval was 40 days for the April 17 planting date versus 18 days for the May 31 planting date, a two-fold difference (Table 2). There was no visibly discernible difference in post-emergent seedling vigor with any planting date, which would be expected given the use of fungicide-treated seed. Despite longer duration from PD to V1 with an earlier planting date, an earlier calendar date of V1 is still valued because of
- an earlier start of linear main stem node accrual that begins at V1, which then leads to more final stem nodes (see the last column in Table 1) and
- an earlier occurrence of V0-V1 which leads to earlier floral induction, and thus an earlier date for R1.
Note that these two impacts can lead to a longer reproductive period prior to R7 (see R1 - R7 column in Table 2).
-
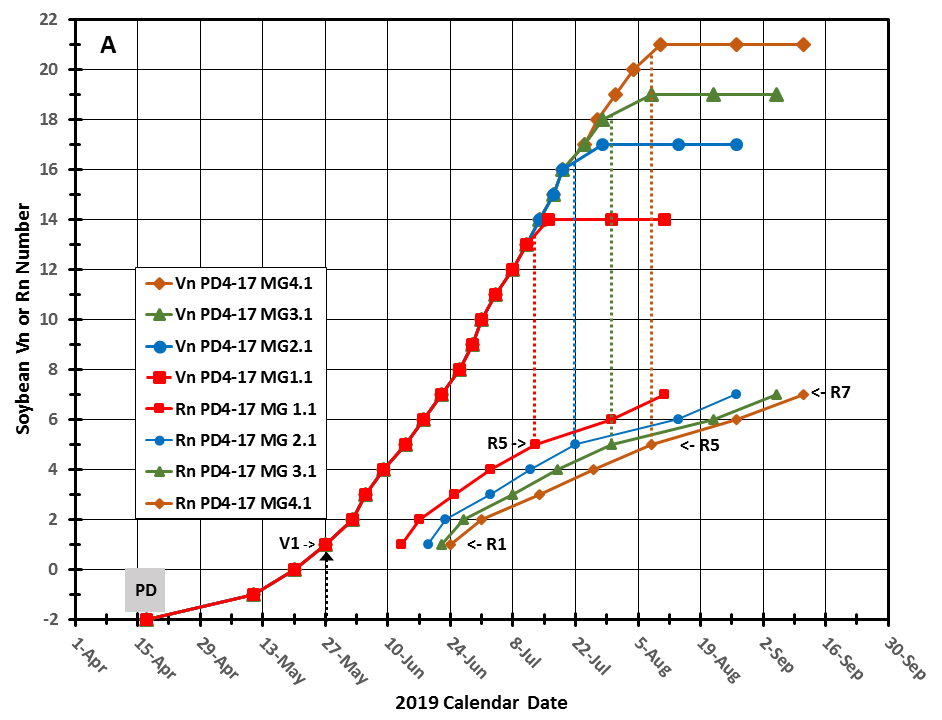
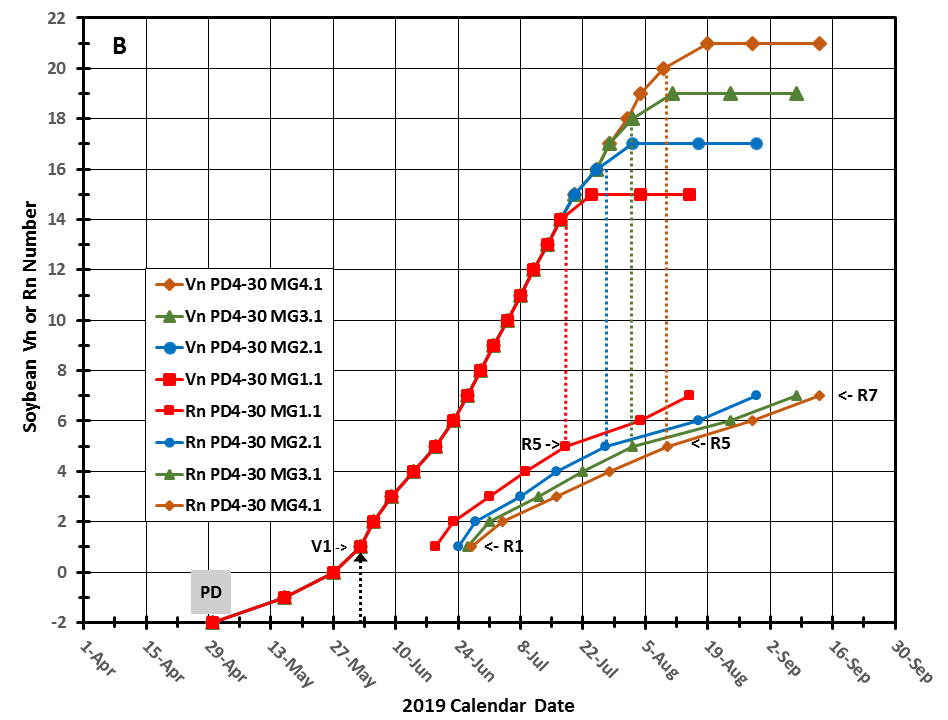
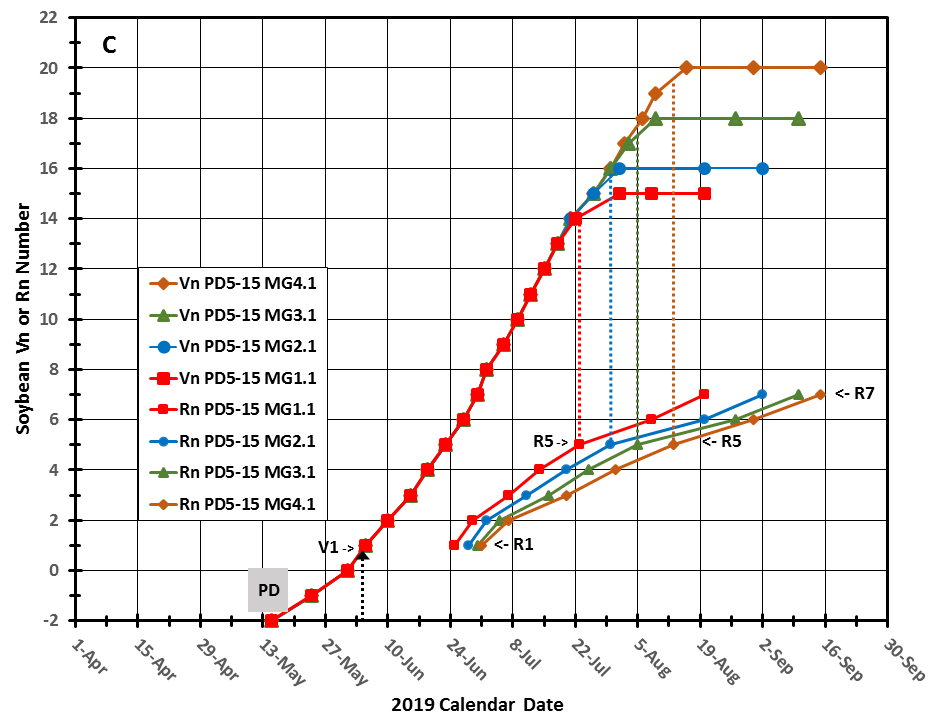
Figure 2 A, B, C, and D. Soybean Vn and Rn stage numbers versus calendar dates of their occurrence for each of the four MGs in each of the four planting dates (panels A, B, C, & D). The planting date (PD) is denoted in grey, After the date of V1, the main stem node accrual is linear until plateauing on the date of R5 (which is MG-dependent). The date of R1 (1st flower), which is also MG-dependent, begins the reproductive period that ends at R7 (physiological maturity). See Table 1 for specific Vn and Rn dates. -
-
-

Charted data often provide perspective on the data trends that are not readily inferable from the tabulated (same) data. Therefore, we plotted the successive main stem Vn node numbers versus their calendar dates of occurrence, as well as the serial progression in Rn stage numbers versus their calendar dates of occurrence. This was done for each of the four varietal MGs grown in each of the four planting dates (i.e., Figure 2 panels A, B, C, D).
The triphasic Vn and Rn trend lines observed in 2019 are nearly identical to the triphasic trends documented in a two-year replicated PD x MG study published 11 years ago (Bastidas et al., 2008). Varieties of differing MG planted on the same date in the same field would be expected to have coincident (overlapping) main stem node accrual rates from V1 onward until plateauing Vn is reached at R5. A later study documented the role that temperature plays in the rate of main stem node accrual (Tenorio, et al., 2017) for different dates/latitudes.
When you toggle through the four Figure 2 graph panels, note that as the planting date is delayed from April 17 to May 31, the V1 date is also delayed, forcing a later start to the linear phase of the main stem node accrual. The dates of R1 (first flower), R5 (beginning seed), and R7 (physiological maturity) are also delayed because the V0-V1 photoperiod induction phase is delayed.
It is also evident that the R1-R7 reproductive phase is delayed when a variety with a longer MG (from 1.1 to 4.1 in this case) is used. In retrospect, it is clear in both Figure 2 (upper right in the graphs) and Table 1 (last column) that the SoyWater-projected final main stem numbers decline when varietal MG is earlier and/or the planting date is later.
Based on 30-year historical data, the date for a 10% or 50% probability of a 32° F temperature at this site is September 26 and October 4, respectively. On the date this article was posted to CropWatch (October 10), a 32° F frost had not yet occurred at the research site at the Eastern Nebraska Research and Extension Center.
Comparing Development for May 17 and July 15 Planting Dates

Because of the 2019 wet spring, many Nebraska soybean fields were planted later than normal, with many planted even later than the latest (May 31) planting date discussed above. In a center pivot field at ENREC, we planted four-row strips of the same varieties on May 17 and then again, two months later, on July 15. The four varieties in the two planting dates were photographed on October 7 and are shown in Figure 3. However, note that the MG order is inverted (i.e., left-to-right order of 4.1 to 1.1) compared to the MG order (1.1 to 4.1) shown in Figure 2. As before, the four-row strips in each planting date in Figure 3 are labeled with their respective SoyWater projected dates of stage R7 (physiological maturity).
The May 17 planting date photo in Figure 2C and the May 15 planting date photo in Figure 3B are observably similar, and in fact, both have near-identical Vn and Rn stage calendar dates. In contrast, the July 15 planting date in Figure 4B shows that the MG 3.1 and 4.1 varieties are still strikingly dark green, though the MG 1.1 and 2.1 varieties are currently changing to a more yellow-green color as expected on their approach to R7. As noted previously, the mild temperatures and absence of water stress this year have led to in-field R7 dates that are later by two, four, six, and eight days than the SoyWater projected R7 dates for the MG 1.1, 2.1, 3.1 and 4.1 varieties.

The graph of the SoyWater-projected Vn and Rn stage trend lines in the July 15 planting date is presented in Figure 4. Because of the very late planting date, we had to shift the calendar date shown on the bottom x-axis from the April 1 – September 30 span shown in Figure 3 to a May 27 – November 13 span shown in Figure 4 to accommodate the late start and late end to crop development. We also highlighted in light blue the calendar date area beyond September 30 to show that, except for the MG 1.1 and maybe the MG 2.1 variety, the ending Rn stages of the later MG varieties will be subject to late-fall colder temperatures. More importantly, these later MG varieties will likely face an early termination of reproductive development, given that at nearby Wahoo, the 30-year historical data shows a 90% probability of a 32°F temperature occurring before October 22 and a 90% probability of a 28°F temperature occurring before October 28.
An approaching cold front is expected to generate frost or freeze temperatures when it arrives in eastern Nebraska this coming weekend (October 11-12). If so, we will provide an update with photos of the frosted or frozen July 15 planted soybean field in the next issue of UNL CropWatch.
References
Bastidas, A.M., T. D. Setiyono, A. Dobermann, K. G. Cassman, R. W. Elmore, G. L. Graef, and J. E. Specht. 2008. Soybean Sowing Date: The Vegetative, Reproductive, and Agronomic Impacts. Crop Science 48:727-740.
Tenorio, F.M., J.E. Specht, T.J. Arkebauer, K.M. Eskridge, G.L. Graef, and P. Grassini. 2017. Co-ordination between Primordium Formation and Leaf Appearance in Soybean (Glycine max) as Influenced by Temperature. Field Crops Research 210:197-216.
Online Master of Science in Agronomy
With a focus on industry applications and research, the online program is designed with maximum flexibility for today's working professionals.
