Nebraska Springs Trending to Warmer and Wetter Conditions
Throughout Nebraska, there has been a long-term trend toward warmer and wetter springs.
During March, April and May we have seen an overall warming, whether you look at longer or shorter time periods. Temperature trends going back to 1895 show about a 3 degree temperature increase in the statewide average. Over jsut the last 30 years, the warming trend increased about 1 degree.
Along with the warmer conditions has come an increase in precipitation. In Nebraska, spring is when we start ramping up precipitation as we experience more convective-type rainfall events. Spring (March, April and May) rainfall has increased by about an inch in the last 30 years. If this wetting trend continues, it may make it more difficult for growers to complete fieldwork in a timely manner.
How has the date of last spring freeze (32°F) changed over time? This trend over the last several decades is not as uniform across the state as what we see for overall spring temperature patterns. Some locations show a trend toward earlier last freeze and some locations show the opposite. The magnitude of these trends, however, are generally not very large and show an earlier or later last freeze by only a few days. A clear pattern across Nebraska, however, is that there is a lot of variability from year to year in the last spring freeze date. It can be as early as the end of March or early April in the southeast and as late as the end of May or even early June for the Panhandle. On average, however, the last freeze date ranges from the third week in April for the southeast to mid-May in the west.
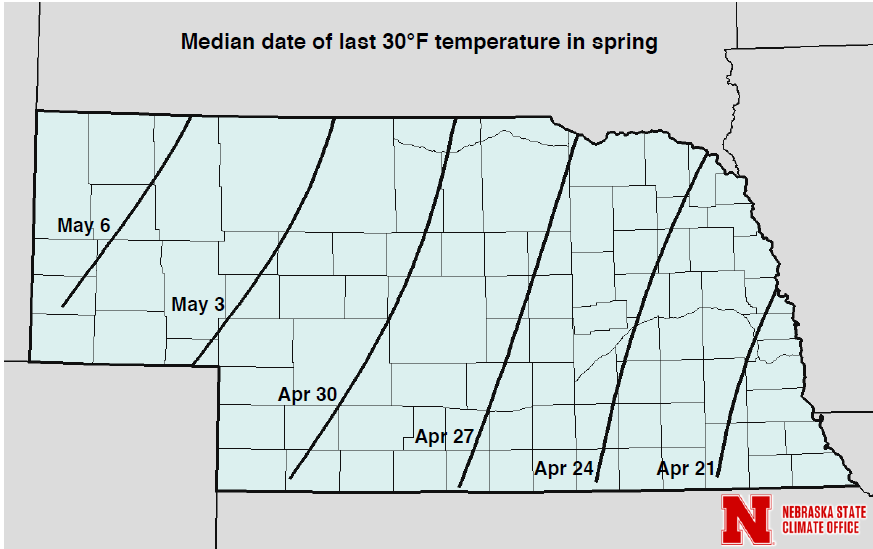
Some vegetation can withstand freezing temperatures. The threshold for a hard freeze is several degrees lower at 28°F. If we zero in on the midpoint of these and look at a 30°F temperature, Figure 1 shows how the median date (50% probability) varies across Nebraska. The median date means that half the time in the last 30 years it has been earlier than the date shown, and half the time it has been later. The 90% probability map (Figure 2) tells us that in most years (90%), the last 30°F temperature has occurred after this date. Conversely, Figure 3 shows when only 10% of last freezes were after this date.
How will This Spring Trend Affect Nebraska Ag?
In this companion article Nebraska Extension Educator Tyler Williams outlines what farmers can expect from warmer and wetter springs.

Online Master of Science in Agronomy
With a focus on industry applications and research, the online program is designed with maximum flexibility for today's working professionals.
