VegScape — An Online Satellite-Based Vegetation Condition Tool
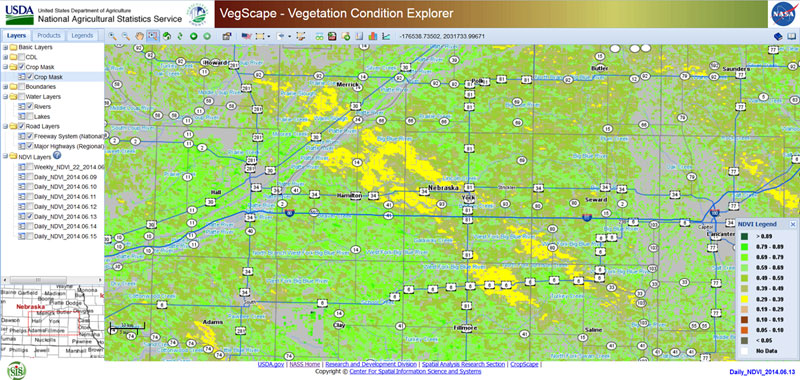
Figure 1. Hail damage from the June 3, 2014 storm in the Hamilton and York County area is clearly visible in two yellow bands from northwest to southeast. This image was taken on June 13.
Crop conditions across the Midwest are scrutinized daily by the grain markets. Each Monday during the crop season the USDA National Ag Statistics Service (USDA-NASS) releases its weekly crop progress and condition reports. To provide further information, in 2013 USDA-NASS launched an online satellite-based crop condition monitoring system called "VegScape." This tool provides easy access to geospatial data and visualization of daily, weekly averaged, and biweekly averaged vegetation condition.
NASA's Moderate Resolution Imaging Spectroradiometer (MODIS) satellite provides daily coverage at a 250-meter (15-acre) spatial resolution and contains 13 years of historic records. VegScape is hosted by the Center for Spatial Information Science and Systems at George Mason University. The vegetation index used in VegScape is the Normalized Difference Vegetation Index (NDVI). NDVI is used to measure and monitor plant growth, vegetative cover, and biomass production with values ranging from 0 to 1 with higher values indicating stronger plant vigor and high chlorophyll content.
VegScape is an easy to use, web-based interactive mapping platform that allows navigation, zooming, panning, and downloading of data. It has been helpful for determining the area impacted by the June 3 hail storms in Nebraska (Figure 1). A nice feature allows downloading any selected index data into Google Earth.
VegScape can be found at http://nassgeodata.gmu.edu/VegScape/. For more information about how to use VegScape, contact Nathan Mueller at Crop Tech Cafe.
Nathan Mueller
Extension Educator
Online Master of Science in Agronomy
With a focus on industry applications and research, the online program is designed with maximum flexibility for today's working professionals.

