Key Takeaways
Warm weather lowered forecasts: Above-normal temperatures during late grain filling lowered yield forecasts at most sites since the previous update.
Irrigated yields mostly below average: Eight of 13 irrigated sites are projected to have below-average yields; the remaining five are expected to have near-average yields.
Rainfed yields mostly near average: Most rainfed sites (74%) are projected to have near-average yields, with seven sites below average and three above average.
Regional outlook slightly below average: Regional yield potential is forecast at 1% below the long-term average.
With corn at or nearing maturity across the Corn Belt, the season’s final yield forecast offers a clearer picture of how this year’s weather shaped yield potential. This final update in the 2026 series reviews simulated crop stages and yield forecasts across the region.
To assess how this year’s weather affects corn yield potential across the Corn Belt as the season progresses, researchers used the UNL Hybrid-Maize crop model to simulate crop development and forecast yields at 43 locations. Simulated crop stages and yield forecasts for each location are provided in Table 1 and Table 2.
Details on the UNL Hybrid-Maize crop model, methods used to simulate crop development and forecast end-of-season yields, and guidance on interpreting and using these forecasts are available in a previous article.
Crop Stages and Weather Conditions During the Last Month
Corn has reached black layer stage at most sites, except for a few in the northern (North Dakota) and northeastern fringes of the region (Michigan, eastern Indiana and eastern Ohio) (Figure 2). During grain filling, above-normal temperatures prevailed across the entire Corn Belt, accelerating crop development and likely shortening the grain filling period by a few days. Rainfall was near-normal at most sites, with only a few scattered locations recording above-average amounts.
A summary of weather conditions during the past four weeks is shown in Figure 1.

| State | City | Water regime | Long-term average yield (bu/ac) § | Range of Yp forecasts as of Sept 21 (bu/ac)? 25th | Range of Yp forecasts as of Sept 21 (bu/ac)? 75th | Probability (%) of 2026 yield to be: Below (relative to the long-term Yp)† | Probability (%) of 2026 yield to be: Near (relative to the long-term Yp)† | Probability (%) of 2026 yield to be: Above (relative to the long-term Yp)† | Simulated current crop stage* |
|---|---|---|---|---|---|---|---|---|---|
| IN | Columbia City | Dryland | 250 | 256 | 267 | 0% | 95% | 4% | R5, Dent |
| MI | Ceresco | Dryland | 233 | 233 | 244 | 0% | 92% | 8% | R5, Dent |
| MI | East Lansing | Dryland | 237 | 235 | 248 | 0% | 100% | 0% | R5, Dent |
| MI | Munger | Dryland | 247 | 231 | 242 | 4% | 95% | 0% | R5, Dent |
| ND | Dazey | Dryland | 167 | 150 | 154 | 25% | 74% | 0% | R5, Dent |
| OH | Wooster | Dryland | 236 | 237 | 251 | 0% | 90% | 9% | R5, Dent |
§Long-term (last 20-plus years) potential yield at each location and surrounding area.
¶ Range of forecasted 2026 potential yields based on average planting date in 2026, indicating the potential yields in the 25th and 75th percentile of the potential yield distribution (associated with respective adverse and favorable weather scenarios during the rest of the season).
| State | City | Water regime | Long-term average yield (bu/ac) § | Black Layer Date | Final Yield | Simulated current crop stage* |
|---|---|---|---|---|---|---|
| NE | Alliance | Irrigated | 230 | Sept. 2 | 223 bu/ac | Matured |
| NE | Beatrice | Dryland | 183 | Aug. 23 | 151 bu/ac | Matured |
| NE | Beatrice | Irrigated | 240 | Aug. 23 | 215 bu/ac | Matured |
| NE | Clay Center | Dryland | 189 | Aug. 31 | 214 bu/ac | Matured |
| NE | Clay Center | Irrigated | 258 | Aug. 31 | 254 bu/ac | Matured |
| NE | Concord | Dryland | 203 | June 19 | 216 bu/ac | Matured |
| NE | Concord | Irrigated | 269 | Aug. 31 | 240 bu/ac | Matured |
| NE | Elgin | Irrigated | 268 | Sept. 2 | 232 bu/ac | Matured |
| NE | Holdrege | Dryland | 143 | Aug. 27 | 103 bu/ac | Matured |
| NE | Holdrege | Irrigated | 257 | Aug. 31 | 262 bu/ac | Matured |
| NE | McCook | Dryland | 118 | Aug. 14 | 36 bu/ac | Matured |
| NE | McCook | Irrigated | 238 | Aug. 19 | 202 bu/ac | Matured |
| NE | Mead | Dryland | 208 | Aug. 28 | 205 bu/ac | Matured |
| NE | Mead | Irrigated | 247 | Aug. 25 | 216 bu/ac | Matured |
| NE | North Platte | Dryland | 130 | Aug. 28 | 100 bu/ac | Matured |
| NE | North Platte | Irrigated | 256 | Aug. 30 | 240 bu/ac | Matured |
| NE | O'Neill | Irrigated | 247 | Sept. 2 | 248 bu/ac | Matured |
| IA | Ames | Dryland | 249 | Aug. 30 | 243 bu/ac | Matured |
| IA | Crawfordsville | Dryland | 238 | Aug. 28 | 241 bu/ac | Matured |
| IA | Kanawa | Dryland | 255 | Sept. 2 | 242 bu/ac | Matured |
| IA | Lewis | Dryland | 223 | Aug. 26 | 216 bu/ac | Matured |
| IA | Nashua | Dryland | 257 | Sept. 4 | 234 bu/ac | Matured |
| IA | Sutherland | Dryland | 245 | Sept. 2 | 218 bu/ac | Matured |
| IL | Bondville | Dryland | 251 | Sept. 1 | 260 bu/ac | Matured |
| IL | Freeport | Dryland | 242 | Sept. 3 | 190 bu/ac | Matured |
| IL | Olney | Dryland | 211 | Aug. 12 | 190 bu/ac | Matured |
| IL | Peoria | Dryland | 229 | Sept. 1 | 247 bu/ac | Matured |
| IL | Springfield | Dryland | 218 | Aug. 23 | 240 bu/ac | Matured |
| IN | Butlerville | Dryland | 237 | Sept. 1 | 261 bu/ac | Matured |
| IN | Davis | Dryland | 258 | Sept. 11 | 258 bu/ac | Matured |
| IN | West Lafayette | Dryland | 255 | Sept. 4 | 278 bu/ac | Matured |
| KS | Garden City | Irrigated | 236 | Aug. 13 | 91 bu/ac | Matured |
| KS | Hutchinson | Dryland | 117 | Aug. 6 | 119 bu/ac | Matured |
| KS | Manhattan | Dryland | 159 | Aug. 11 | 168 bu/ac | Matured |
| KS | Scandia | Dryland | 157 | Aug. 19 | 178 bu/ac | Matured |
| KS | Scandia | Irrigated | 234 | Aug. 23 | 221 bu/ac | Matured |
| KS | Silverlake | Dryland | 163 | Aug. 14 | 168 bu/ac | Matured |
| MN | Eldred | Irrigated | 218 | Aug. 17 | 210 bu/ac | Matured |
| MN | Eldred | Dryland | 166 | Sept. 3 | 97 bu/ac | Matured |
| MN | Lamberton | Dryland | 246 | Sept. 5 | 248 bu/ac | Matured |
| MN | Waseca | Dryland | 247 | Sept. 6 | 266 bu/ac | Matured |
| MO | Brunswick | Dryland | 195 | Aug. 23 | 199 bu/ac | Matured |
| MO | Monroe City | Dryland | 192 | Aug. 24 | 220 bu/ac | Matured |
| MO | St. Joseph | Dryland | 190 | Aug. 19 | 195 bu/ac | Matured |
| OH | Custar | Dryland | 230 | Sept. 15 | 225 bu/ac | Matured |
| OH | South Charleston | Dryland | 234 | Sept. 1 | 243 bu/ac | Matured |
§Long-term (last 20-plus years) potential yield at each location and surrounding area.
¶ Range of forecasted 2026 potential yields based on average planting date in 2026, indicating the potential yields in the 25th and 75th percentile of the potential yield distribution (associated with respective adverse and favorable weather scenarios during the rest of the season).


Irrigated Corn: Near or Below-Average Yields
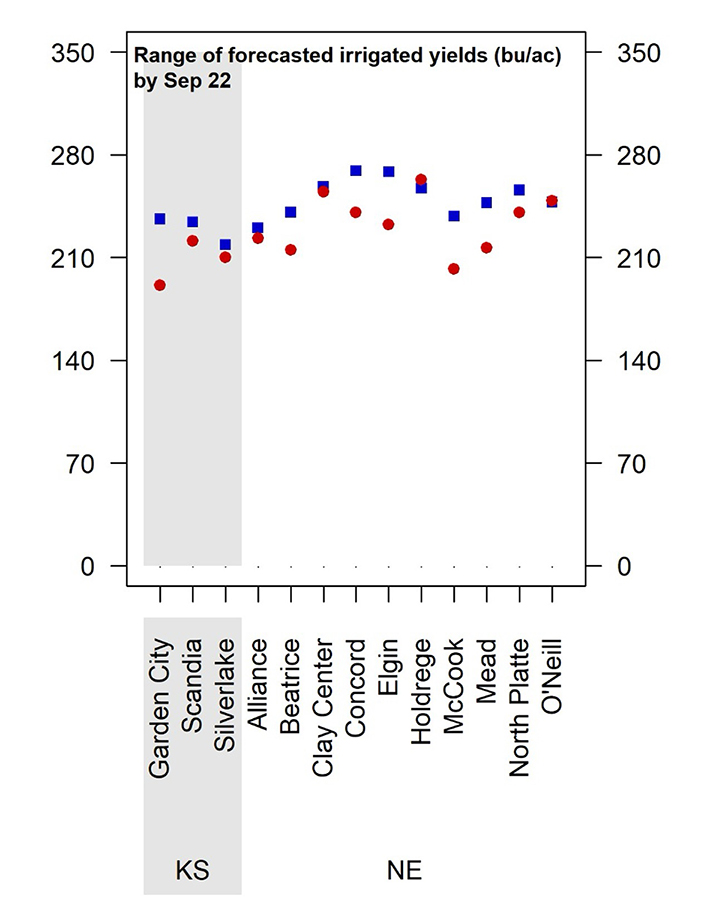
Forecasted end-of-season irrigated yields are shown in Figures 3 and 4. Most irrigated sites (eight out of 13) show below-average yields, while the remaining sites are projected to achieve near-average yields.
Warm weather during late grain filling in Nebraska has lowered forecasted irrigated yields from our previous forecast. Forecasted yields are also lower than the final forecasts for 2024 and 2025.
Rainfed Corn: Variation in Forecasted Yields
Most rainfed corn sites are projected to achieve near-average yields. Overall, 74% of the sites (29 out of 39) fall into this category, while 18% (seven out of 39) show a high probability of below-average yields.
Below-average yields are expected at sites located in southwestern Nebraska and North Dakota (Figures 3 and 4). Only three sites — in south-central Nebraska, north-central Kansas and northeastern Missouri — are projected to achieve above-average yields.
Since our previous forecast, above-normal nighttime temperatures during late grain filling have lowered predicted yields at most sites where corn had not yet reached maturity.
Overall, forecasted rainfed yield for 2026 is lower than the final forecast for 2025 and close to the long-term average.


Conclusions
At the regional level, forecasted yield potential this season is 1% below the long-term average. Below-average yields are expected at the majority of irrigated sites, while most rainfed sites (75%) are projected to achieve near-average yields.
These forecasts do not take into consideration problems with stand emergence, hail/flooding damage, replanting situations, disease or nitrate leaching. In fields negatively affected by these constraints, actual yields will be lower than estimates provided here.
It is important to keep in mind that yield forecasts are not field specific and, instead, represent an estimate of average on-farm yield for a given location and surrounding area in the absence of the yield-reducing factors mentioned here. Likewise, crop stages and forecasted yields will deviate from those reported here in fields with planting dates or hybrid maturities that differ markedly from those used as the basis for the forecasts.