Key Takeaways
Irrigated corn: Near- to below-average yields are expected due to above-average nighttime temperatures during flowering and early grain filling.
Rainfed corn: Yield prospects remain strongest across the central and eastern Corn Belt, while western areas face a greater risk of below-average yields.
Looking ahead: Late-season temperature and rainfall will be critical in determining final yield potential.
Corn across much of the U.S. Corn Belt has progressed into the grain-filling stages, and weather conditions during the remainder of the season will continue to shape end-of-season yield potential.
Simulations of corn growth and end-of-season yield potential were completed on Aug. 4 for 43 locations across the U.S. Corn Belt using the UNL Hybrid-Maize crop model in collaboration with faculty and Extension educators from 10 universities. Simulated crop stages and yield forecasts for each location are provided in Table 1.
This article summarizes the simulated crop stages and yield forecasts. Details on the UNL Hybrid-Maize crop model, the methodology used to simulate crop development and forecast end-of-season yields, and guidance on interpreting and using these forecasts are available in a previous article.
Above-average temperatures, especially at night, were observed in the central, western, and northern regions of the Corn Belt, while the eastern region (Indiana, Missouri, Ohio) experienced near-normal temperatures. High temperatures can lead to a shorter grain filling duration. In addition, nighttime temperatures exceeding 70°F increase crop respiration and can reduce crop growth.
Rainfall was below average in the northern (North Dakota and northern Minnesota), central (western Iowa and Illinois), and south-central (Missouri) regions. In contrast, above-average rainfall was recorded in northeastern kansas. A summary of weather conditions during the past three weeks is shown in Figure 1.

| State | City | Water regime | Long-term average yield (bu/ac) § | Range of Yp forecasts as of Aug 4 (bu/ac)? 25th | Range of Yp forecasts as of Aug 4 (bu/ac)? 75th | Probability (%) of 2026 yield to be: Below (relative to the long-term Yp)† | Probability (%) of 2026 yield to be: Near (relative to the long-term Yp)† | Probability (%) of 2026 yield to be: Above (relative to the long-term Yp)† | Simulated current crop stage* |
|---|---|---|---|---|---|---|---|---|---|
| NE | Alliance | Irrigated | 230 | 215 | 238 | 27% | 48% | 24% | R4, Dough |
| NE | Beatrice | Dryland | 183 | 141 | 157 | 91% | 8% | 0% | R4, Dough |
| NE | Beatrice | Irrigated | 240 | 211 | 221 | 91% | 8% | 0% | R4, Dough |
| NE | Clay Center | Dryland | 189 | 178 | 228 | 11% | 45% | 43% | R4, Dough |
| NE | Clay Center | Irrigated | 258 | 248 | 269 | 15% | 63% | 20% | R4, Dough |
| NE | Concord | Dryland | 203 | 194 | 231 | 11% | 47% | 40% | R4, Dough |
| NE | Concord | Irrigated | 269 | 242 | 265 | 61% | 36% | 2% | R4, Dough |
| NE | Elgin | Irrigated | 268 | 252 | 275 | 34% | 52% | 13% | R4, Dough |
| NE | Holdrege | Dryland | 143 | 90 | 129 | 76% | 23% | 0% | R4, Dough |
| NE | Holdrege | Irrigated | 257 | 256 | 275 | 13% | 42% | 44% | R4, Dough |
| NE | McCook | Dryland | 118 | 43 | 51 | 100% | 0% | 0% | R5, Dent |
| NE | McCook | Irrigated | 238 | 213 | 229 | 65% | 31% | 2% | R4, Dough |
| NE | Mead | Dryland | 208 | 200 | 218 | 9% | 81% | 9% | R4, Dough |
| NE | Mead | Irrigated | 247 | 213 | 226 | 84% | 15% | 0% | R4, Dough |
| NE | North Platte | Dryland | 130 | 84 | 121 | 70% | 29% | 0% | R4, Dough |
| NE | North Platte | Irrigated | 256 | 243 | 272 | 22% | 47% | 29% | R4, Dough |
| NE | O'Neill | Irrigated | 247 | 243 | 270 | 7% | 51% | 41% | R4, Dough |
| IA | Ames | Dryland | 249 | 240 | 262 | 5% | 81% | 13% | R4, Dough |
| IA | Crawfordsville | Dryland | 238 | 233 | 257 | 5% | 77% | 16% | R4, Dough |
| IA | Kanawha | Dryland | 255 | 243 | 261 | 3% | 96% | 0% | R4, Dough |
| IA | Lewis | Dryland | 223 | 183 | 218 | 57% | 42% | 0% | R4, Dough |
| IA | Nashua | Dryland | 257 | 243 | 259 | 10% | 83% | 5% | R4, Dough |
| IA | Sutherland | Dryland | 245 | 222 | 239 | 21% | 75% | 2% | R4, Dough |
| IL | Bondville | Dryland | 251 | 257 | 277 | 0% | 64% | 35% | R4, Dough |
| IL | Freeport | Dryland | 242 | 227 | 254 | 16% | 69% | 13% | R4, Dough |
| IL | Olney | Dryland | 211 | 195 | 203 | 5% | 94% | 0% | R5, Dent |
| IL | Peoria | Dryland | 229 | 243 | 267 | 0% | 42% | 57% | R4, Dough |
| IL | Springfield | Dryland | 218 | 240 | 251 | 0% | 38% | 61% | R4, Dough |
| IN | Butlerville | Dryland | 237 | 250 | 265 | 0% | 52% | 47% | R4, Dough |
| IN | Columbia City | Dryland | 250 | 254 | 287 | 4% | 52% | 43% | R2, Blister |
| IN | Davis | Dryland | 258 | 266 | 278 | 0% | 86% | 13% | R3, Milk |
| IN | West Lafayette | Dryland | 255 | 279 | 301 | 0% | 30% | 69% | R4, Dough |
| KS | Garden City | Irrigated | 236 | 207 | 220 | 82% | 17% | 0% | R5, Dent |
| KS | Hutchinson | Dryland | 117 | 119 | 122 | 0% | 100% | 0% | R5, Dent |
| KS | Manhattan | Dryland | 159 | 172 | 178 | 0% | 63% | 36% | R5, Dent |
| KS | Scandia | Dryland | 157 | 178 | 189 | 0% | 15% | 85% | R4, Dough |
| KS | Scandia | Irrigated | 234 | 216 | 234 | 35% | 62% | 2% | R4, Dough |
| KS | Silverlake | Dryland | 163 | 170 | 180 | 0% | 67% | 32% | R5, Dent |
| KS | Silverlake | Irrigated | 218 | 213 | 226 | 15% | 72% | 12% | R5, Dent |
| MI | Ceresco | Dryland | 233 | 241 | 273 | 0% | 60% | 40% | R2, Blister |
| MI | East Lansing | Dryland | 237 | 246 | 264 | 0% | 66% | 33% | R2, Blister |
| MI | Munger | Dryland | 247 | 243 | 268 | 0% | 76% | 23% | R2, Blister |
| MN | Eldred | Dryland | 166 | 111 | 145 | 80% | 20% | 0% | R4, Dough |
| MN | Lamberton | Dryland | 246 | 257 | 275 | 0% | 65% | 34% | R4, Dough |
| MN | Waseca | Dryland | 247 | 263 | 292 | 0% | 43% | 56% | R4, Dough |
| MO | Brunswick | Dryland | 195 | 178 | 198 | 23% | 73% | 3% | R4, Dough |
| MO | Monroe City | Dryland | 192 | 210 | 225 | 0% | 36% | 64% | R4, Dough |
| MO | St. Joseph | Dryland | 190 | 200 | 211 | 0% | 73% | 26% | R5, Dent |
| ND | Dazey | Dryland | 167 | 164 | 205 | 16% | 35% | 48% | R3, Milk |
| OH | Custar | Dryland | 230 | 222 | 250 | 7% | 73% | 19% | R3, Milk |
| OH | South Charleston | Dryland | 234 | 240 | 259 | 0% | 72% | 27% | R4, Dough |
| OH | Wooster | Dryland | 236 | 236 | 266 | 0% | 63% | 36% | R2, Blister |
§Long-term (last 20-plus years) potential yield at each location and surrounding area.
¶ Range of forecasted 2026 potential yields based on average planting date in 2023, indicating the potential yields in the 25th and 75th percentile of the potential yield distribution (associated with respective adverse and favorable weather scenarios during the rest of the season).
† Probability of obtaining a 2026 yield below, near, and above than the long-term potential yield at each location (±10% for rainfed sites; ±5% for irrigated sites)
Simulated Corn Stage Across 43 Locations
Corn has reached the dent stage in the southern fringe of the Corn Belt (Kansas, western Missouri, and southern Illinois). In the rest of the region, corn has reached the dough stage, except for a few sites in the northern and eastern regions (North Dakota, Michigan, and parts of Indiana and Ohio) where corn remains in the milk or even blister stage. In general, current corn development is similar to the 2025 crop season (Figure 2).


Irrigated Corn: Near- or Below-Average Yields
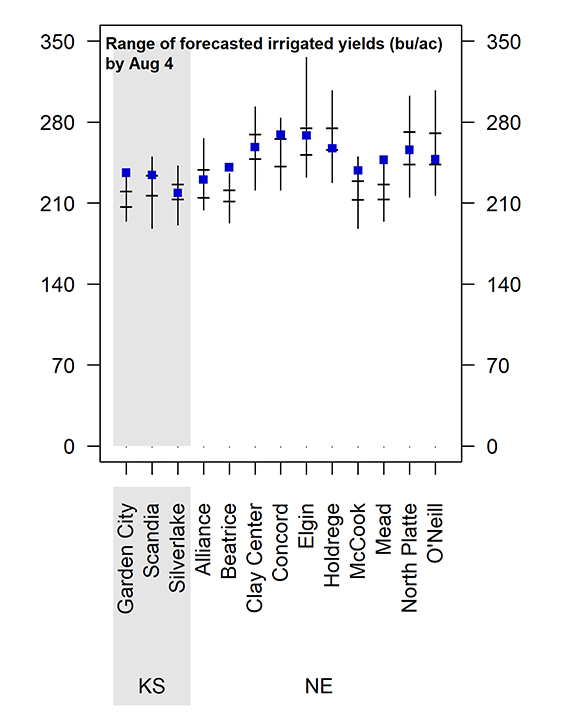
The range of forecasted irrigated corn yield potential for each location, as well as the probability for yields above, near, or below average, are shown in Figures 3 and 4. Due to above-average nighttime temperatures, above-average yields are unlikely, and five sites in Nebraska and Kansas already have a high probability of below-average yields. At the remaining sites, temperature during the rest of grain filling will determine whether yields finish near or below average. Overall, the outlook for irrigated corn in Kansas and Nebraska is more pessimistic than last year's and similar to that in prior years with high nighttime temperatures like 2023.
Variation in Forecasted 2026 Rainfed Corn Yields
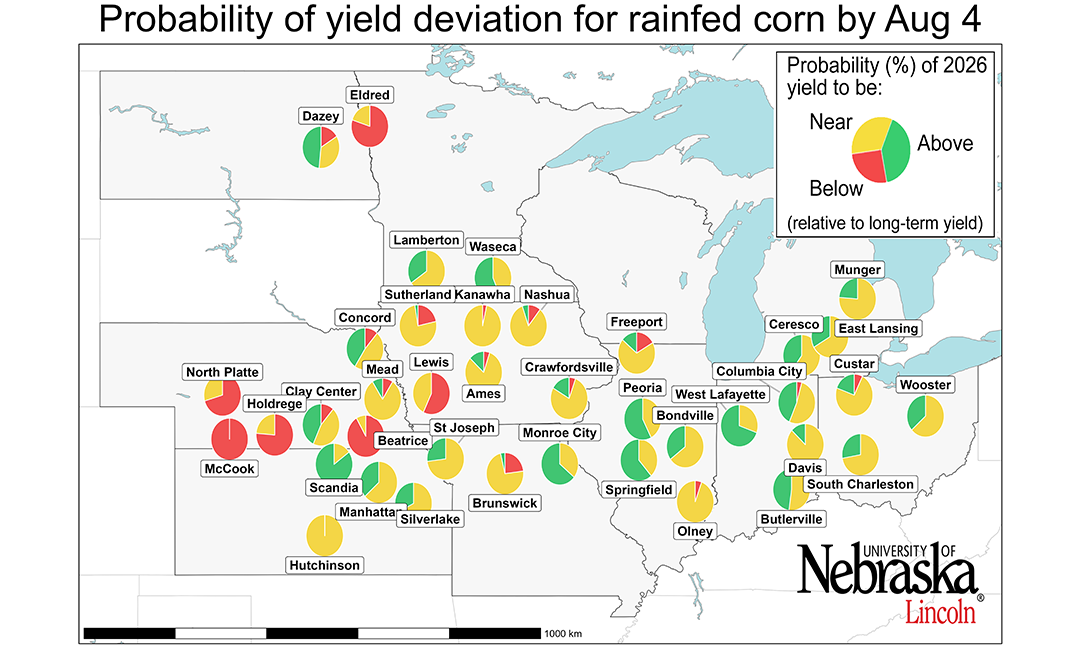
Forecasted yield potential is variable across rainfed sites (Figures 3 and 4). Despite generally below-average rainfall during the past three weeks, the probability of near-average yields is high in the central and eastern regions (most of Iowa, Missouri, Illinois, Indiana, Michigan, and Ohio) and at a few scattered sites in Nebraska and Kansas. Favorable water balances during June and early July are likely to have reduced the effects of temporary water shortages in late July. Indeed, there is a high probability of near-average yields (greater than 75%) at 13 sites across the Corn Belt.
The probability of below-average yields increases toward the western Corn Belt (southwest Iowa, southeast and western Nebraska, and northern Michigan), where four sites show a high probability of below-average yields (greater than 75%).
The probability of above-average yields is low across most of the Corn Belt, except for one site in northern Kansas and a few scattered sites in the eastern states.
Compared with the previous forecast, below-average rainfall across the central and western Corn Belt during the past three weeks reduced the probability of above-average yields, except at sites in northeastern Kansas. In contrast, the outlook remained similar for the eastern sites. Conditions at eastern sites changed little. Compared with 2025, the current outlook remains similar across the central and eastern Corn Belt but more pessimistic to the west.


Conclusions
Near- or below-average irrigated yields are expected because of nighttime temperatures during flowering and early grain filling.
Rainfed yields are expected to be near average for the eastern and central Corn Belt, but below average for most of the western region.
Temperature and rainfall during the rest of the grain filling will define the trend for the rainfed sites across the region. These forecasts do not account for problems with stand emergence, hail/flooding damage, replanting situations, disease or nitrate leaching. In fields negatively affected by these constraints, actual yields will be lower than estimates provided here.
It is important to keep in mind that yield forecasts are not field specific. Instead, represent an estimate of average on-farm yield for a given location and the surrounding area, assuming none of the yield-reducing factors listed above are present. Likewise, crop stages and forecasted yields will deviate from the ones reported here in fields with planting dates or hybrid maturities that differ markedly from those used as the basis for the forecasts.
Updated forecasts will be released in late August.