Nebraska soybean and corn yields have steadily increased from 1971 to 2017 in both irrigated and rainfed production systems. Charts of yield and acreage updated to 2017 are presented here (Figures 1 and 2), and also depicted in the new updated CropWatch Soybean and Corn sections.
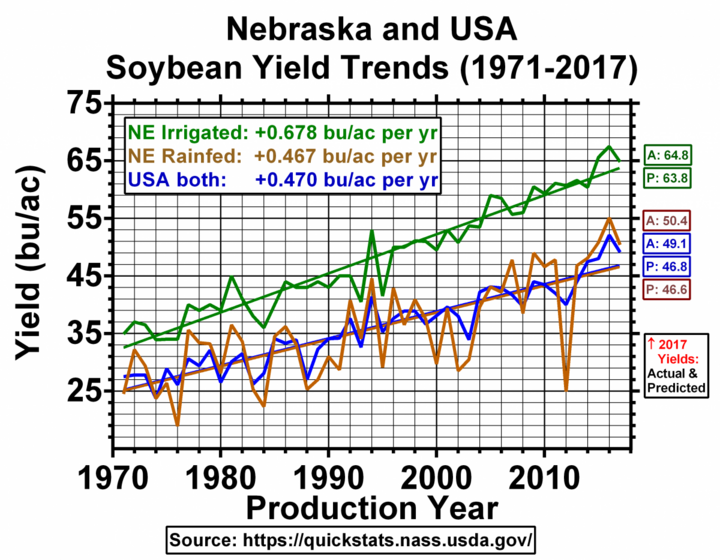
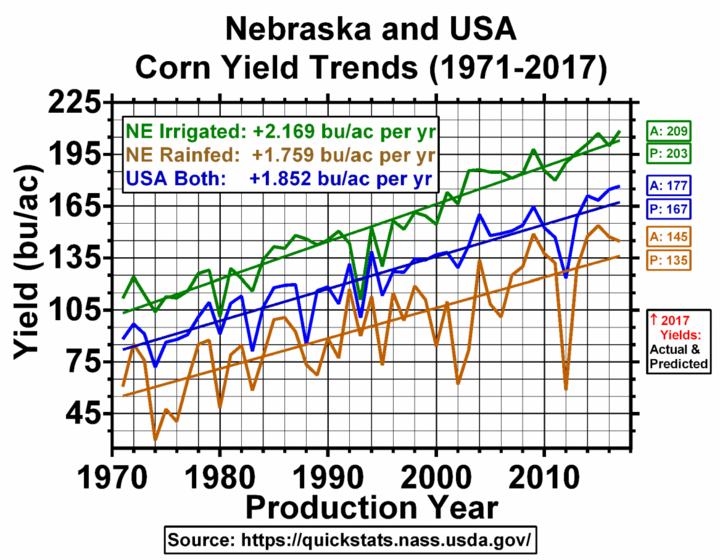
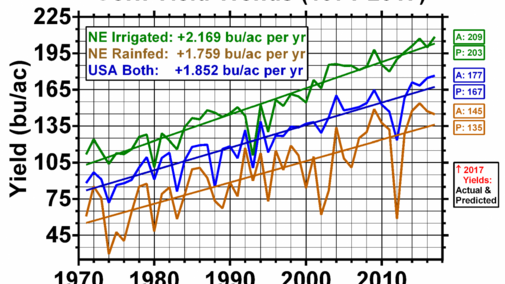
During the past 47 years, Nebraska soybean irrigated and rainfed yields have increased at respective (linear) rates of 0.68 and 0.47 bushels per acre per year (Figure 1, soybean). US soybean yields also increased at a rate of 0.47 bushels per acre per year. Nebraska corn irrigated and rainfed yields have increased at respective (linear) rates of 2.17 and 1.76 bushels per acre per year (Figure 1, corn), whereas US corn yields increased at a rate of 1.85 bushels per acre per year.
Note that actual rainfed soybean and corn yields have been consistently higher than their respective 47-year linear trend line predicted yields during the past five years (2013 to 2017). The color-coded boxed numbers on the right side of the charts indicate the Actual (A) and trend-line Predicted (P) 2017 yield numbers (Figure 1). A five-year “run” of higher-than-projected rainfed yields is considered to be atypical in a statistical linear regression analysis of historical data.
Indeed, prior “yield-favorable runs” shown in these two crop charts typically had durations of three years or less; such short-term runs are consistent with the well-known adage that “(new) observations are expected to regress (back) to the mean (trend line).” This is based on the assumption that the fundamental environmental factors generating annual deviations from a yield trend line have not changed over time, so deviations, either up or down, would be expected to occur at random from year-to-year. That said, a five-year “run” of crop yields above-the-yield-trend-line would have a very low (a priori) probability of occurrence, though even improbable events (e.g., “1000-year flood”) can occur at any time in a historical sense.
Predictions for 2018 Yields Based on 1971 to 2017 Trend Lines
So, what will soybean and corn yields be in 2018? Theoretically, one can predict a 2018 yield by adding the annual bu/ac increase in yield number shown in the top center of a crop chart to the same color-coded predicted 2017 yield number shown in the P box on the right side of the crop chart. For example, the 2018 Nebraska rainfed soybean yield prediction would be 46.6 + 0.467 = 47.1 bu/ac, using the brown-colored rainfed numbers in the soybean chart (Figure 1, top).
Current 2018 Yield Projections
In a recent CropWatch article, the authors reported that the Hybrid-Maize simulation model was currently projecting above normal rainfed corn yields in Nebraska and in the north central US. On August 10 USDA-NASS projected 2018 US soybean and corn yields of 51.6 and 178.4 bushels per acre, respectively. Both would be record yields. The Nebraska yield projections for the combined irrigated and rainfed soybean and corn production systems were a respective 61.0 and 196 bushels per acre. If these US and Nebraska predictions are actually realized this fall, another year would be added to the current four- or five-year “favorable yield runs” at the end of the US and Nebraska yield trend lines (Figure 1). However, favorable rainfall and temperatures will need to occur the rest of August and into early September to ultimately attain these projected record yields.
The Corn/Soybean Yield Ratio ― a Two-Crop Measure of Management?
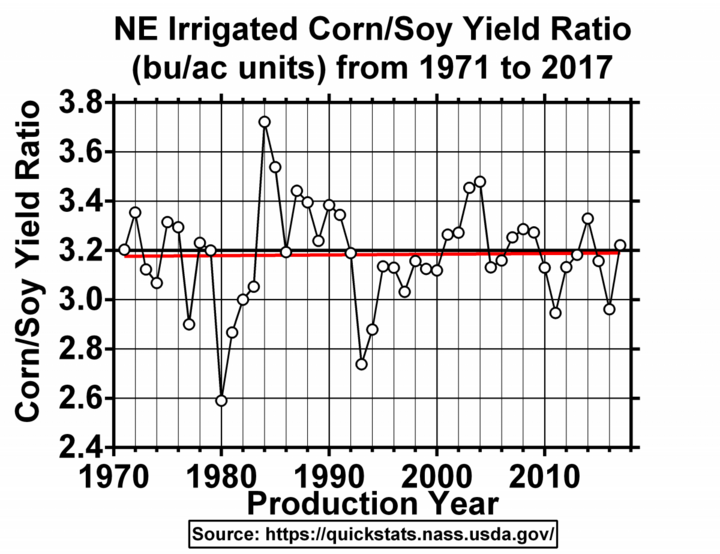
In Nebraska fields where corn and soybean are rotated annually, the ratio of corn yield to soybean yield in irrigated production has not changed much over the past 47 years, averaging 3.2 (Figure 2). Indeed, division of the annual 2.17 bu/ac increase in Nebraska irrigated corn yield by the annual 0.68 bu/ac increase in Nebraska irrigated soybean yield (Figure 1) is also 3.2 (2.17 ÷ 0.68 = 3.2). This corn/soybean yield ratio can be of use to a soybean/corn producer in the sense that, if you divide your Nebraska farm’s irrigated corn yield by your farm’s irrigated soybean yield for a given year (or for multiple years), you should also arrive at a number close to 3.2. This assumes you are successfully managing both irrigated crops to get close to their respective yield potentials, allowing, of course, for some year-to-year deviation (as seen in Figure 2). Thus, if your irrigated corn yield is 256 bu/ac, your irrigated soybean yield should be close to 80 bu/ac (256 ÷ 3.2 = 80).
There is a caveat to this 3.2 rule-of-thumb. Soil characteristics in your particular area of the state may mitigate the irrigated yield potential of one crop versus the yield potential of the other crop. For example: soybean is more sensitive than corn to iron-deficiency chlorosis that occurs in calcareous soils.
Trends in Harvested Acres
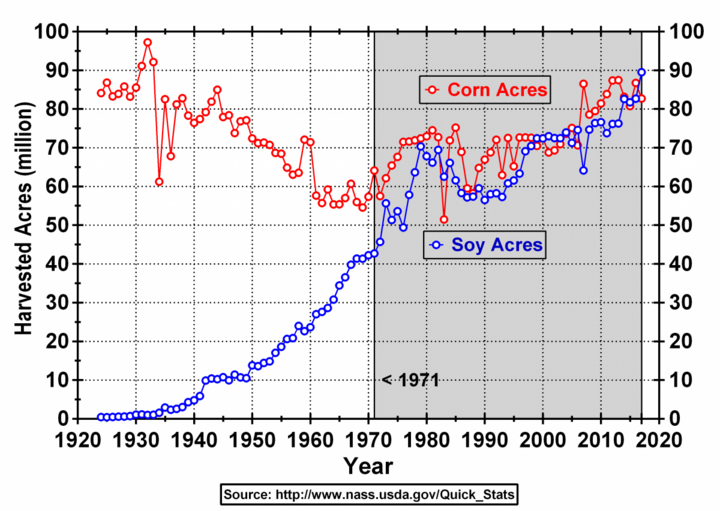
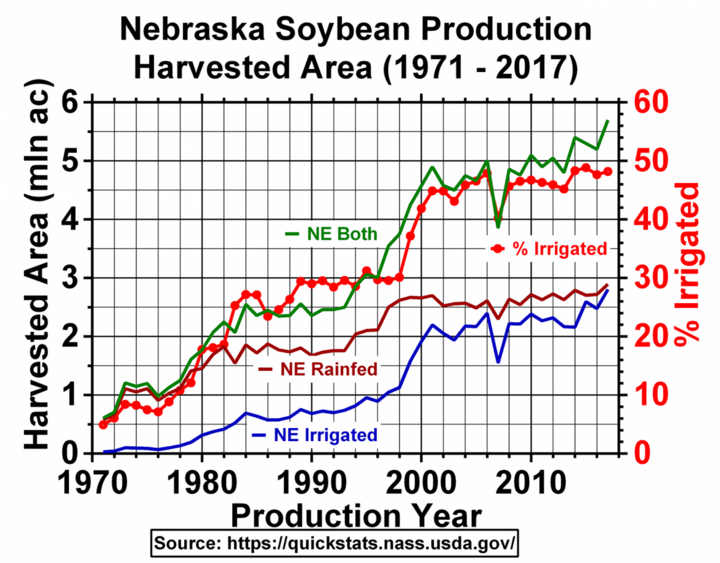
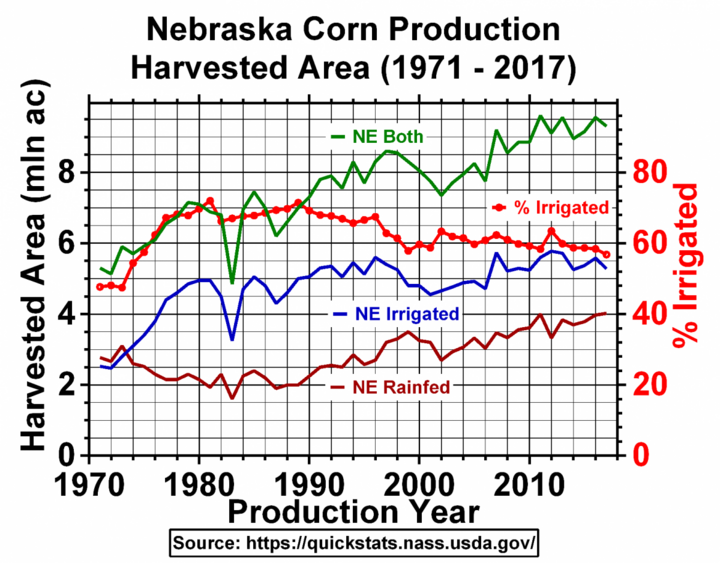
About 48% of the state’s 2017 total soybean acreage was irrigated (Figure 3), whereas 56% of the 2017 total corn acreage was irrigated (Figure 3). Readers of this CropWatch article who may be unfamiliar with irrigated crop production in Nebraska, might be surprised to know that since 1981, the percentage of irrigated corn acreage has actually declined from 72% to 56% while since 2001, the percentage of irrigated soybean acreage has gradually increased from 40% to 48%.
For context, it is interesting to compare the foregoing 1971-2017 changes in the Nebraska acreages of soybean and corn with the changes in US acreages of these two crops from 1924 to 2017 (Figure 4). Note the rapid rise in US soybean acreage from 1950 to 1980, when soybean acreage finally reached near-parity with US corn acreage. Last year (2017) the 89,862,000 acres of US harvested soybean substantively exceeded the 82,770,000 acres of corn harvested in the US.
In Nebraska 5,670,000 acres of soybean and 9,300,000 acres of corn were harvested, accounting for a respective 6.3% and 11.2% of the nation’s total soybean and corn acreage that year. The USDA-NASS 2018 harvested acreage projections for soybean and corn as of August 10 were a respective 88,900,000 and 81,800,000 acres. This would be the second year in a row that US soybean acreage has exceeded US corn acreage (Figure 4). The projected 2018 harvested acreages in Nebraska are a respective 5,450,000 acres and 9,350,000 acres.