Simulations of real-time crop stage were performed for 41 locations across the US Corn Belt using the UNL Hybrid-Maize crop model in collaboration with faculty and extension educators from 10 universities. Additionally, end-of-season forecasts of corn grain yield potential for all major irrigated corn growing regions and for rainfed corn in Nebraska, Kansas, North Dakota, and Minnesota will be provided. Download the Aug. 30 forecast data in Table 1. Details on the UNL Hybrid-Maize crop model and the underpinning methodology to simulate phenology and forecast end-of-season yields, as well as information on interpretation and uses of yield forecasts is described in a previous article.
The 2017 growing season continued with near average air temperatures in mid- to late August. Both nighttime and daytime temperatures were remarkably below normal across the entire region. A summary of weather conditions since the Aug. 9 forecast is shown in Figure 1.
Simulated Corn Stage Across 41 Locations
Grain filling is in full swing throughout Nebraska and the Corn Belt (Figure 2). Corn is still at blister stage at a few locations in the northern Corn Belt, including eastern North Dakota, northern Minnesota, western Nebraska, and southern Michigan.

Figure 1. Daily solar radiation, maximum and minimum air temperature (Tmax and Tmin), total rainfall, and total reference grass-based evapotranspiration (ET) for August 9-30, 2017. Vertical bars indicate the range for these variables based on 20+ years of weather records. The horizontal thick line indicates the long-term average and the red dots indicate the 2017 values.
(Links to larger version)
Vn: vegetative stage (nth leaf); R1: silking; R2: blister; R3: milk; R4: dough; R5: dent; Matured (“black layer”).
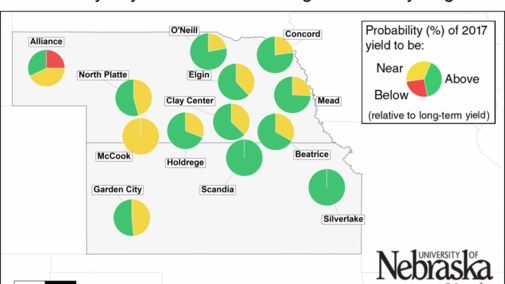
Separate maps are shown for irrigated corn (above) and rainfed corn (right).

Irrigated Corn: High Probability of Near- and Above-Average Yields
The range of forecasted irrigated corn grain yield potential for each location, as well as the probabilities for yields above, near, or below average, are shown in Figures 3 and 4. About 40% of the irrigated sites exhibit a high-probability (>75%) of above-average yield potential, respectively. The chance of below-average yield is minimal across all irrigated sites.
Figure 3. Vertical lines indicate the range of forecasted 2017 corn yield potential on August 30 based on average planting date in 2017 at each location. Horizontal lines indicate the 25th and 75th percentiles of the yield distribution (associated with respective adverse and favorable weather scenarios during the rest of the season). Long-term (2005-2016) average yield potential at each location is indicated with a blue square. Separate charts are shown for irrigated corn (left) and rainfed corn (right). Final forecasted yield is indicated with a red square for those sites where corn already matured.


Variable 2017 Forecasted Corn Yield Across Rainfed Locations
Forecasted yield potential looks highly variable across rainfed sites (Figures 3 and 4). There is a relatively high probability of above-average yield along a northwest-southeast transect in Nebraska and Kansas, including North Platte, Holdrege, Beatrice, Scandia, Manhattan, and Silverlake. Forecasted yields are also above average for the locations in southern Minnesota. In contrast, there is a high-probability of below-average yield in North Dakota and northwestern Minnesota. Near-average yields are forecasted for the rainfed sites in southwestern Nebraska (McCook) and south-central Kansas.
Conclusions
Forecasted yields followed the trends observed in the previous yield forecasts released Aug 3. Growing conditions until August 30 indicate high probability of above- and near-average yields across all sites, except for the northern fringe of the region.
These forecasts do not take into consideration problems with stand emergence, hail/flooding damage, replanting situations, disease, or nitrate leaching. In fields negatively affected by these constraints, actual yields will be lower than estimates provided here. It is important to keep in mind that yield forecasts are not field specific and, instead, represent an estimate of average on-farm yield for a given location and surrounding area in absence of the yield-reducing factors mentioned here. Likewise, crop stages and forecasted yields will deviate from the ones reported here in fields with planting dates or hybrid maturities that differ markedly from the ones used as the basis for the forecasts. We will follow up with further forecasts in September.
