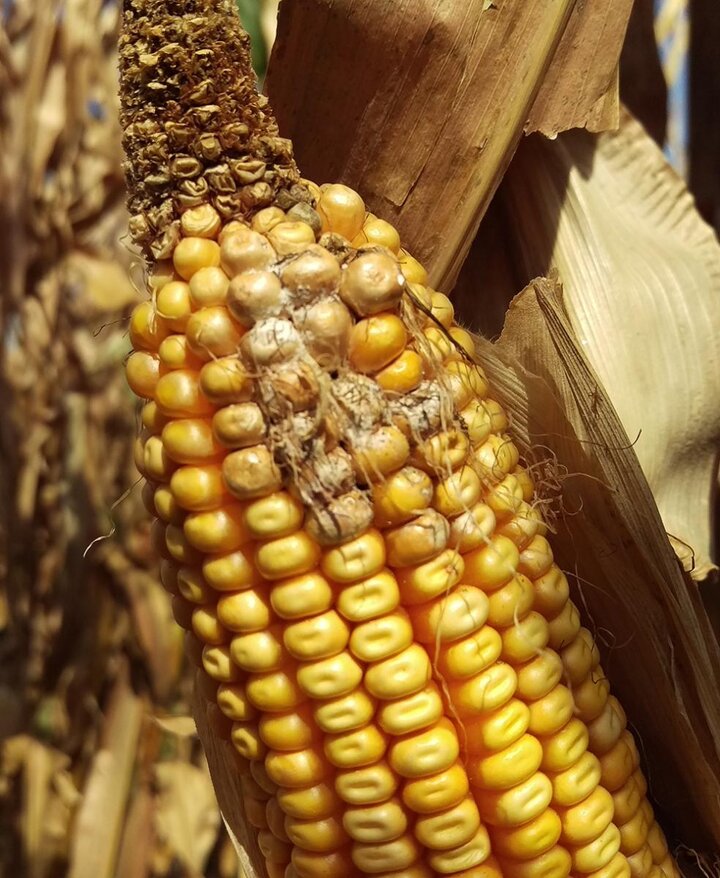
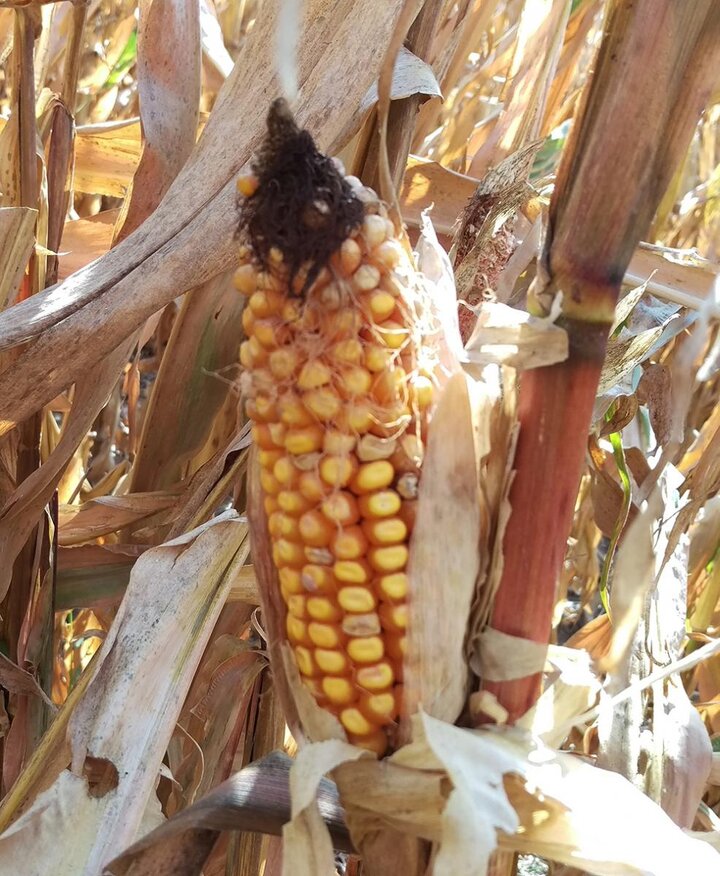
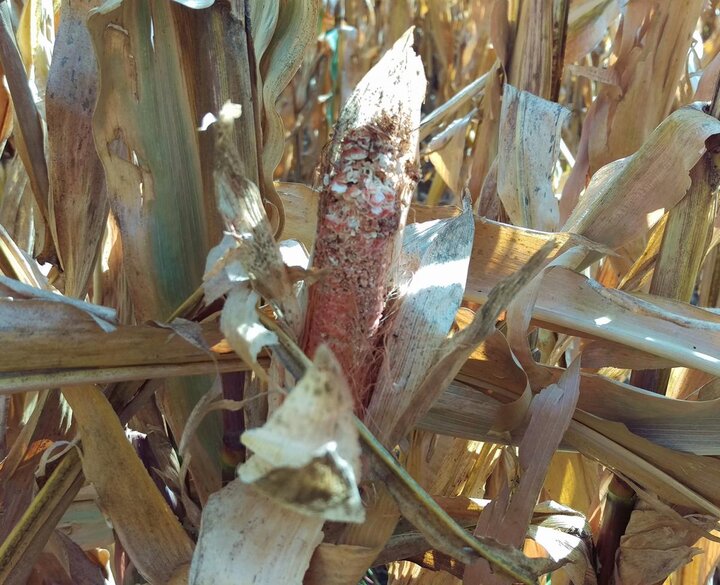
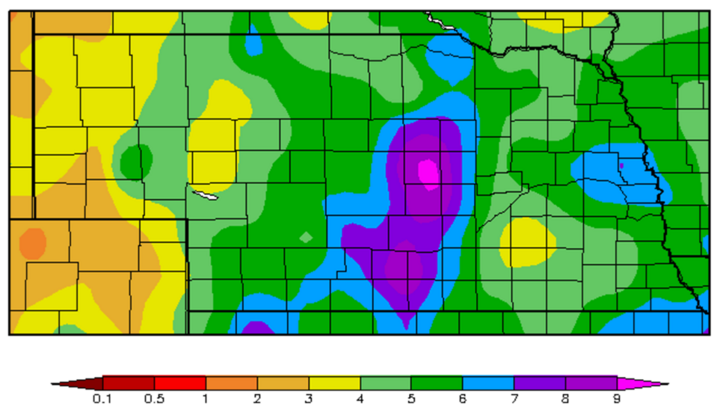
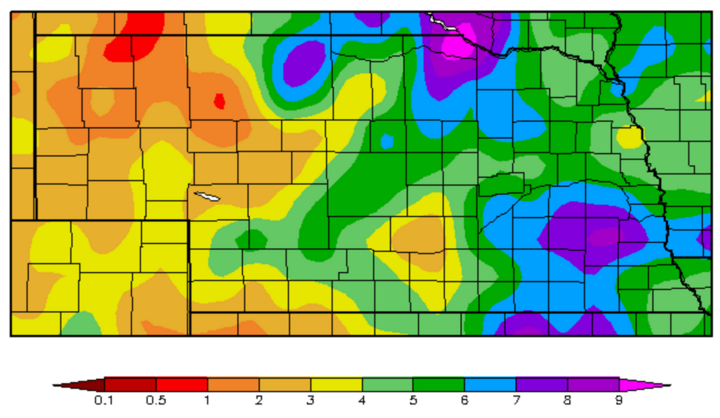
Corn harvest has begun in many areas of the state and producers are reporting varying yield results as we had anticipated. Some are reporting yields that exceeded their goals while others are reporting yields below expectations and questioning what may have happened. Conditions varied widely across the state from the start of the 2016 season to harvest, with potential impact on crop production and yields from individual fields becoming apparent now (Figures 1 a-c). In this article, we address some of the possible causes for reduced yield in the hopes of helping producers troubleshoot their own situations and consider adjustments for the future.
Planting and Early Season
As we review planting and early season conditions, variability in precipitation with excess moisture (Figure 2 a-b) in some locations led to variable planting dates with some replanting. It also led to variable emergence and plant growth within fields. Damping off and other seedling diseases were a problem in some fields and in some hybrids, resulting in stand losses.
Excess moisture may have resulted in denitrification and/or leaching of nitrogen in some fields where nitrogen was applied pre-plant. If rescue treatments or the majority of nitrogen could not be applied in-season, nitrogen stress may have occurred.
Excess moisture also affected some post-herbicide applications which may have resulted in weed pressure in some fields, potentially impacting yield.
Also see
Mid-Season
As June rolled around, growers may recall plants appearing yellow from lack of root development from April/May rainfall. We also had high heat and high winds in June (Figure 3) which made the soil hard and increased plant stress from lack of root development. Some corn plants were in a critical growth stage (V5-V8) during this time. Irrigation was recommended to help reduce plant stress.
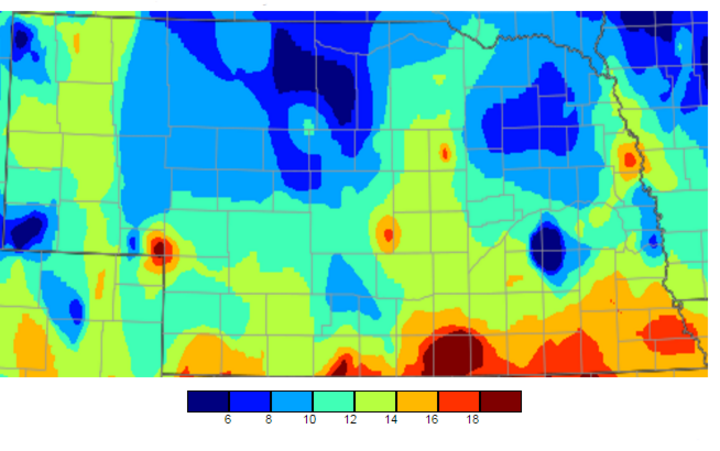
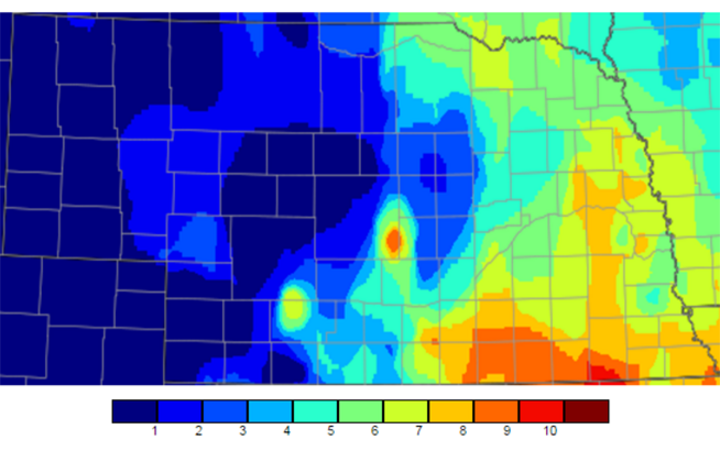
Rapid plant growth continued to occur. A cold snap over the July 4 weekend followed by a July 7 windstorm with hail affected pockets throughout the state. Plants most affected by greensnap were between V10 and V14 growth stage at this time. By the end of July there was a period of high nighttime temperatures which may have affected kernel setting (Figure 4). By late summer, portions of the state were in drought due to limited rainfall from early June through August (Figure 5). Solar radiation was good for both corn and soybean yields; however, the high relative humidity (Table 1, below) resulted in reduced evapotranspiration (ET). The high humidity did appear to help plants in drought-stricken areas hang on longer. Ear malformation concerns were also observed on racehorse hybrids and determined to be the loss of the primary ear node although exact reasons for this are still being determined.

Insects such as western bean cutworms and grasshoppers were an issue throughout the state this past year. Spider mite flare-ups occurred during milk to early dent growth stages with some farmers questioning additional pesticide applications given current economics.
Leaf Diseases
Leaf diseases were found at varying severities in corn in several parts of Nebraska.
-
Bacterial leaf streak (BLS) — BLS was officially reported in August 2016, but likely present in some areas of Nebraska prior to that. The disease severity has varied greatly in different parts of the state and on different hybrids. Thus far, the disease has been confirmed in at least 45 counties stretching from southwest to northeast Nebraska. No samples from the Panhandle or extreme southeast Nebraska have tested positive. In some corn fields BLS developed in the lowest leaves during vegetative stages, as early as V7. In some sensitive hybrids, such as some popcorn, it continued to worsen throughout the season; in other hybrids, its development stalled or stopped for most of the remaining season. In other fields, it was only reported after July storms and developed in the upper canopy first.
The disease affects leaf area, which could ultimately impact grain fill and yield as the disease becomes more severe. However, one of the biggest challenges with the disease is that it is frequently misdiagnosed as other diseases, such as the fungal disease gray leaf spot. It has been common in areas with gray leaf spot, such as in south central. Sometimes both diseases have occurred in the same fields and in the same leaves, complicating diagnosis and treatment decisions. In some fields this and other foliar diseases quickly developed later in the growing season and may have had an impact on yield.
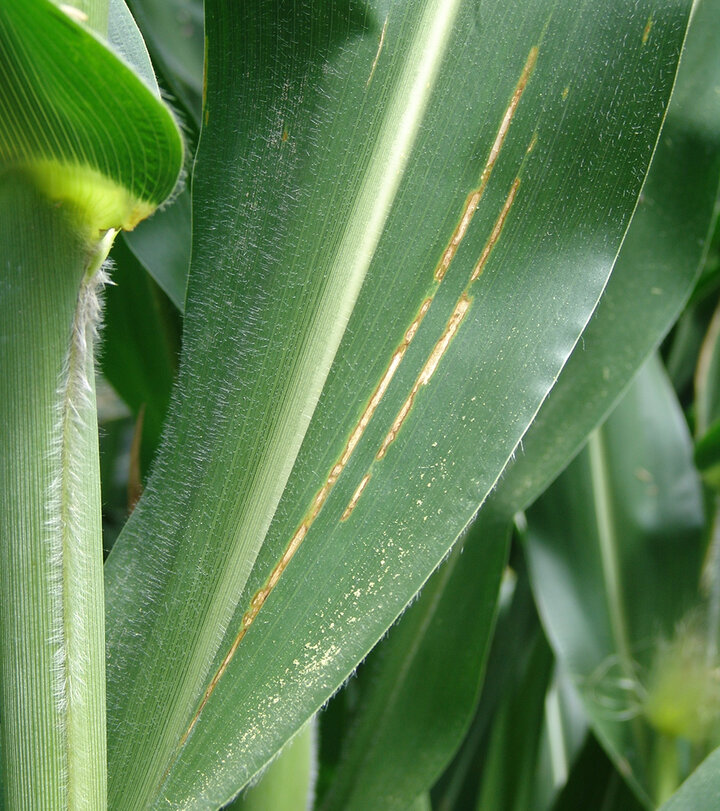
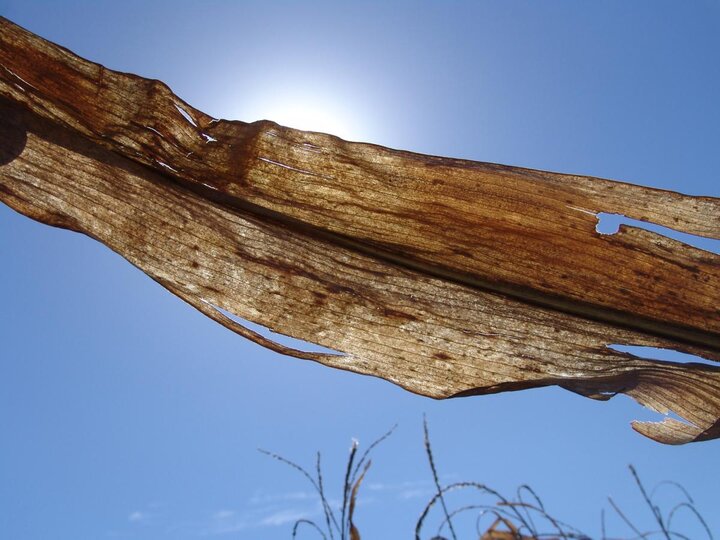
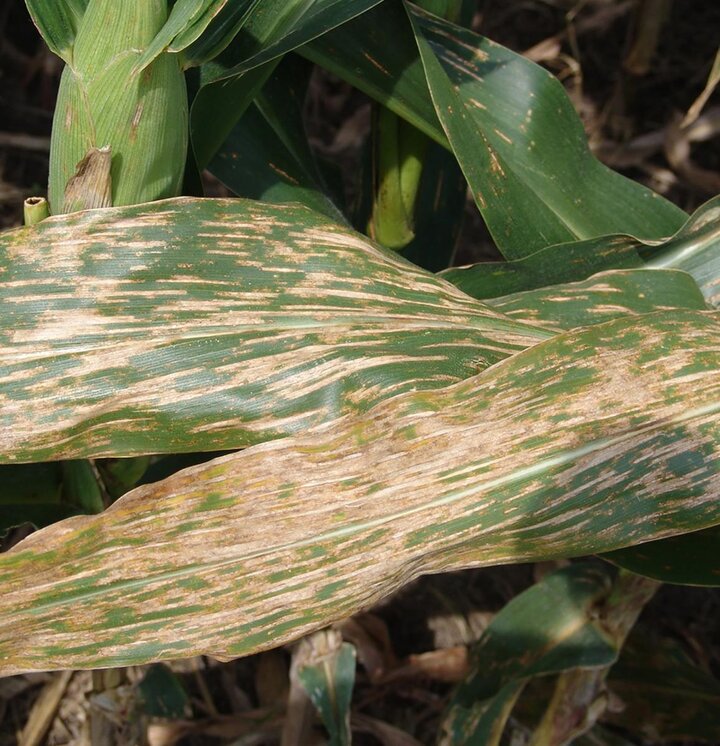
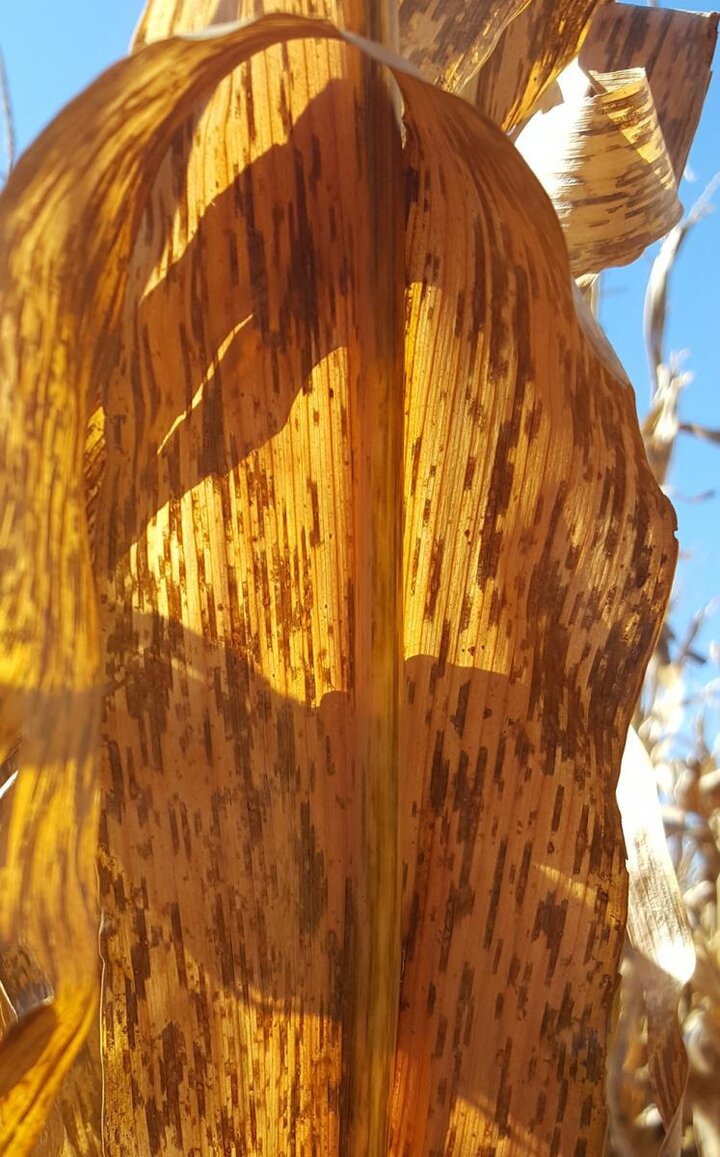
Figure 7 a-b. Gray leaf spot lesions are rectangular with smooth, linear margins. The outline of lesions may still be visible on dead, dried leaf tissue, but diagnosis is difficult after senescence, especially if multiple disease lesions are present.
- Gray leaf spot (GLS) — The fungal disease gray leaf spot (GLS) is common in most of Nebraska. The fungus is favored by warm, damp conditions or high relative humidity and causes rectangular lesions between veins. These lesions begin on the lowest leaves and progress upward throughout the season as long as conditions persist. The fungus overwinters in infected crop debris from previous seasons and so is favored by continuous corn and minimum tillage systems. Fortunately, many hybrids are now more resistant to the disease and foliar fungicides can provide effective control. However, this disease quickly developed late in the season and may have impacted yield in some fields.
- Southern corn rust (SCR) — The SCR fungus is not known to overwinter in Nebraska and spores blow in from southern locations. SCR was confirmed in late July in Nebraska. It was slow to develop in some parts of the state, but increased quickly in others, such as in south central Nebraska. Some producers were surprised at the rapid increase in rust late season that may have impacted yield and standability. Foliar fungicides can help manage the disease, but application timing decisions are difficult. Growers need to anticipate when the disease will develop and taking advantage of the window of protection, expected to be 21-28 days for most systemic products.
-
Diagnostics — Unfortunately, samples submitted to the UNL Plant & Pest Diagnostic Clinic for diagnosis at harvest may have limited value for identifying certain problems that may have impacted yield earlier in the season. Many pathogens may still be detectable, but it may be impossible to determine their earlier severity, whether they could have impacted yield, and what other potential problems may have also contributed to yield loss.
Keep in mind that it is important to provide as much information as possible when submitting a sample, including the distribution of symptoms in the field, on the plant, and on various plant parts. It’s also helpful to provide when plants developed symptoms and the appearance of other seemingly unaffected plants.
Drydown and Fill Period
September resulted in corn appearing to rapidly lose health and we didn't see the long period of drying husks on green stalks as is often observed. Weather data shows a period with very low solar radiation during this time, which may have impacted corn plants physiologically (Figure 8).
Stalk and Ear Rot Diseases
Several stalk and ear diseases were observed in the state and may have impacted yield, depending on when they developed during grainfill.
-
Stalk rot diseases — Several stalk rot diseases can cause early plant death and potentially impact yield if they infect and develop early. These diseases are caused by fungi that survive in the soil and infect and develop in plants that may have been grown under crop stress, such as nutrient deficiency, moisture imbalance (too wet or too dry), wounding, and loss of leaf area, such as caused by leaf diseases, among others. Hybrid selection may help to reduce the incidence of stalk rot diseases. Using the push or pinch tests can help to identify corn fields with compromised stalks. Anthracnose stalk rot (and top dieback), as well as Fusarium stalk rot have been observed, and others, such as charcoal rot, which is more common in dry growing conditions, also could be possible. Harvesting high risk fields first or early may help to avoid harvest losses due to lodging, but may lead to grain drying costs.
- Ear rot diseases — Ear rot diseases have only been observed in a few areas of the state since harvest progress is still early. It’s important to scout high risk fields and to know whether they’re a problem to help make informed decisions about storage, feeding, etc.
For more information see the article in this week's CropWatch, Ear and Stalk Rot Diseases Becoming More Common in Corn Fields.

Conclusion
A number of factors across this production season may be affecting yields. If you are experiencing lower than expected yields, we would recommend considering the factors listed in this article to help determine what might have affected your crop on a field-by-field basis.
If you have more specific questions about your corn fields, please contact your local agronomist or one of the authors.
| June - Aug 2016 Average | June - Aug. 2016 Normal | June - Aug 2016 Dep. | July 2016 Average | July 2016 Normal | July 2016 Dep. | ||
|---|---|---|---|---|---|---|---|
| AINSWORTH | 66.6 | 67.5 | -0.9 | 70.1 | 65.9 | 4.2 | |
| ALLIANCE NORTH | 57.7 | 59.9 | -2.2 | 58.3 | 58.3 | 0.0 | |
| ALLIANCE WEST | 56.7 | 57.8 | -1.0 | 57.7 | 56.7 | 1.0 | |
| BEATRICE | 71.7 | 73.3 | -1.7 | 76.0 | 73.1 | 2.9 | |
| CHAMPION | 67.2 | 63.2 | 4.1 | 70.3 | 62.4 | 7.9 | |
| CLAY CENTER | 72.1 | 73.6 | -1.5 | 76.7 | 74.0 | 2.8 | |
| CONCORD | 73.9 | 74.4 | -0.5 | 78.2 | 75.1 | 3.1 | |
| CURTIS (UNSTA) | 65.4 | 63.4 | 2.1 | 69.8 | 62.3 | 7.5 | |
| DICKENS | 63.6 | 64.8 | -1.2 | 68.5 | 64.0 | 4.5 | |
| ELGIN | 72.4 | 72.5 | -0.1 | 77.9 | 72.6 | 5.3 | |
| GORDON | 57.5 | 59.3 | -1.8 | 59.4 | 57.3 | 2.1 | |
| GRAND ISLAND | 69.9 | 72.9 | -2.9 | 76.8 | 73.5 | 3.3 | |
| GUDMUNDSEN ReSeaRCH Ranch | 64.6 | 65.0 | -0.4 | 67.5 | 63.3 | 4.2 | |
| HALSEY | 65.1 | 64.5 | 0.6 | 69.6 | 63.2 | 6.4 | |
| HAVELOCK | 69.8 | 69.8 | 0.0 | 74.2 | 69.1 | 5.0 | |
| HOLDREGE | 68.4 | 69.1 | -0.7 | 72.7 | 68.3 | 4.4 | |
| HOLDREGE 4N | 72.4 | 69.6 | 2.8 | 79.1 | 69.3 | 9.8 | |
| KEARNEY | 66.5 | 71.1 | -4.6 | 72.3 | 71.5 | 0.8 | |
| LINCOLN (IANR) | 67.6 | 68.2 | -0.6 | 71.3 | 67.3 | 4.0 | |
| MCCOOK | 64.1 | 62.1 | 2.0 | 67.2 | 60.9 | 6.3 | |
| MEAD | 75.6 | 74.2 | 1.3 | 80.4 | 75.3 | 5.1 | |
| MINDEN | 71.2 | 71.1 | 0.1 | 76.9 | 71.3 | 5.6 | |
| NORTH PLATTE | 65.8 | 65.7 | 0.1 | 70.5 | 65.2 | 5.3 | |
| ONEILL | 69.5 | 69.6 | -0.1 | 72.7 | 68.7 | 4.0 | |
| ORD | 70.3 | 69.5 | 0.8 | 74.7 | 68.5 | 6.2 | |
| RED CLOUD | 67.4 | 69.0 | -1.6 | 69.2 | 67.9 | 1.3 | |
| SCOTTSBLUFF | 55.0 | 56.0 | -1.1 | 56.0 | 55.0 | 1.0 | |
| SHELTON | 71.0 | 73.1 | -2.1 | 77.7 | 74.1 | 3.7 | |
| SIDNEY | 55.2 | 55.1 | 0.1 | 53.6 | 52.5 | 1.1 | |
| SMITHFIELD | 73.0 | 68.2 | 4.9 | 79.4 | 67.8 | 11.6 | |
| WEST POINT | 75.3 | 74.0 | 1.3 | 80.8 | 75.0 | 5.7 | |
| YORK | 71.7 | 72.0 | -0.3 | 76.9 | 72.2 | 4.7 |
