Nebraska soybean and corn yields steadily increased from 1971 to 2016, in both irrigated and rainfed production fields. Updated yield and acreage statistics are now presented below and in the CropWatch sections for soybean and corn.


During this 46-year period, Nebraska soybean irrigated and rainfed yields increased at respective annual (linear) rates of 0.68 and 0.44 bushels per acre per year. In that same time, US soybean yields increased at an annual rate of 0.45 bushels per acre per year.
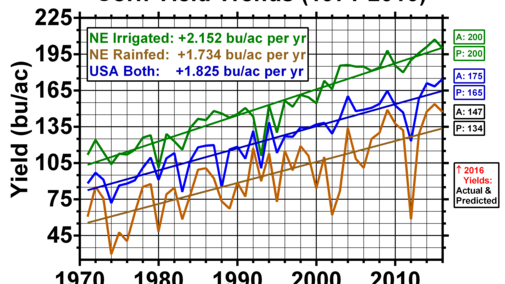
Over the same 46 years, Nebraska irrigated and rainfed corn yields increased at the respective annual (linear) rates of 2.2 and 1.7 bushels per acre per year. US corn yields increased at an annual rate of 1.8 bushels per acre per year.
In a forthcoming CropWatch article, we will address whether the past few years of very high soybean yields represent the establishment of a true new yield level that will continue into the future, or whether these consecutive high yield years are just “outliers,” and thus regression to the mean can be expected in future years.


The number of Nebraska acres harvested each year for soybean and corn from 1971 to 2016 is also shown on the CropWatch Soybean and Corn section pages. About 48% of the state’s 2016 total soybean acreage was irrigated, whereas about 60% of the 2016 total corn acreage was irrigated.
CropWatch readers unfamiliar with irrigated crop production in Nebraska might be surprised that, since 2001, the percentage of irrigated soybean acreage has not changed much (increasing from 40% to 48%), and since 1981, the percentage of irrigated corn acreage has actually declined significantly (from 72% to 60%).
For context, it is interesting to compare the 1971-2016 changes in the Nebraska acreages of soybean and corn with the changes in US acreages of these two crops from 1924 to 2016. (The grey highlighting denotes the 1971-2016 era depicted in the Nebraska acreage charts.) Note the rapid rise in US soybean acreage over the past 97 years to reach near-parity with US corn acreage. In 2016, Nebraska accounted for 6.3% and 11.0% of the nation’s total soybean and corn acreage.

Soybean & Corn Guide
These charts are among many key resources for corn and soybean production in the new 2017 Nebraska Soybean and Corn Pocket Field Guide. Copies were mailed to about 23,000 Nebraska soybean/corn producers by the Nebraska Soybean Board and Nebraska Corn Board. The Pocket Guide, which was printed in late 2016, contains charts showing production statistics through the 2015 production year. Yields and acreages by county are on pages 21-23 for soybean and pages 136-138 for corn.

150 Years of US Corn Acreage
USDA began collecting US soybean production statistics in 1924; however, they’ve collected US corn production statistics since 1866. This chart shows changes in US harvested corn acreage over that longer timeframe.
