
Simulations of 2025 end-of-season corn yield potential and real-time crop stage were performed on July 15 for 43 locations across the U.S. Corn Belt using the UNL Hybrid-Maize crop model in collaboration with faculty and extension educators from 10 universities. This article summarizes the simulated crop stages and yield forecasts; the data can be viewed in Table 1 below. Details on the UNL Hybrid-Maize crop model and the underpinning methodology to simulate phenology and forecast end-of-season yields, as well as on interpretation and uses of yield forecasts, are described in a previous article.
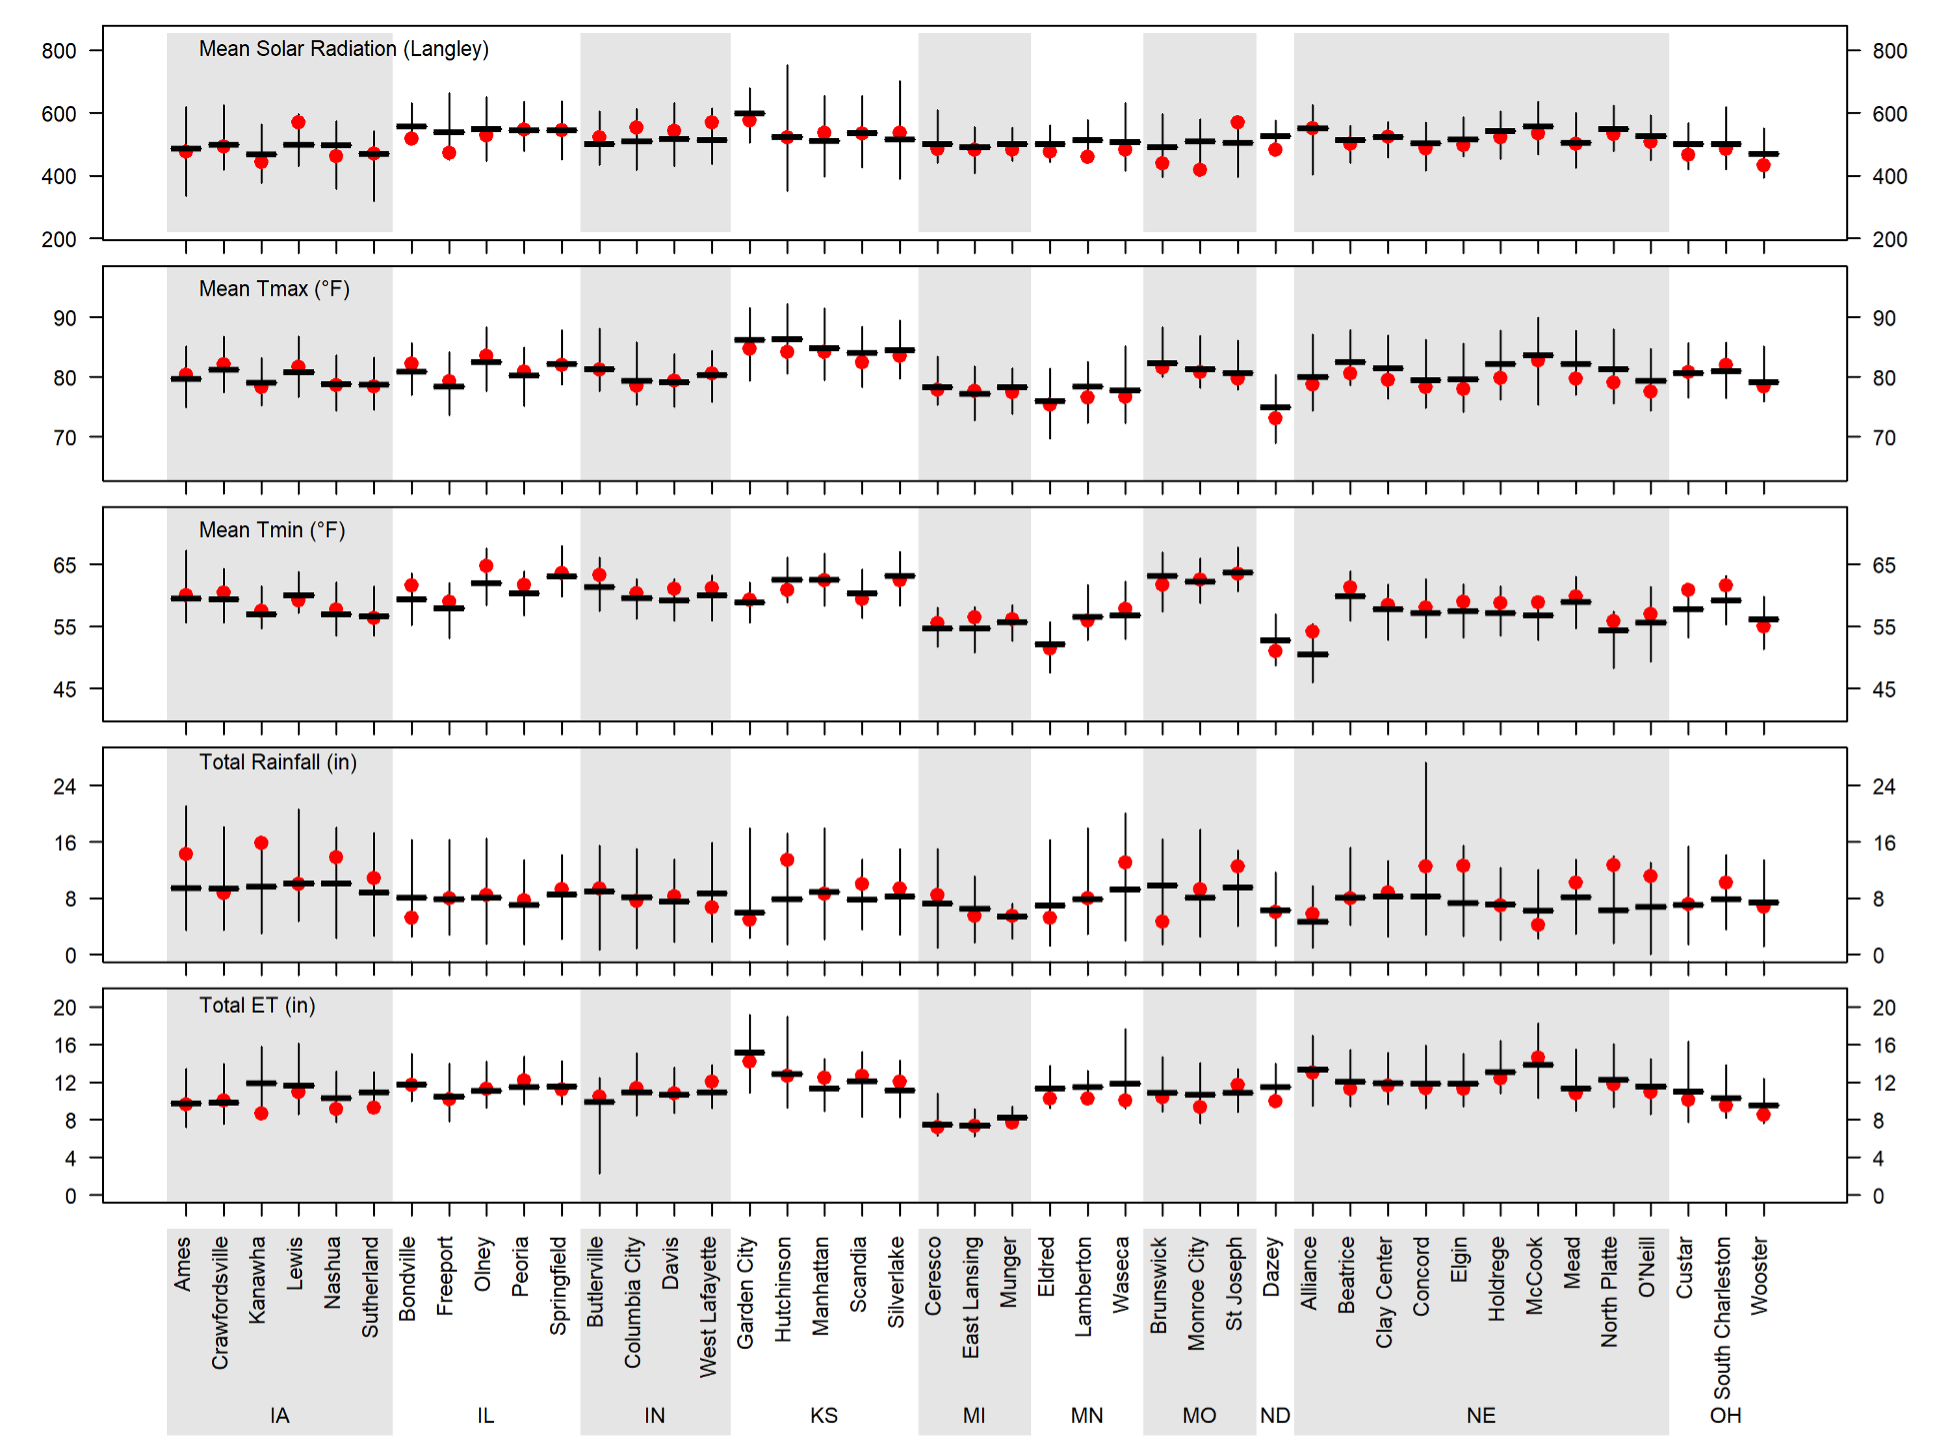
A summary of weather conditions during the last 60 days (from May 15 to July 14) is shown in Figure 1. The season began with near-average temperatures in the central Corn Belt, while daytime temperatures were below normal in the western fringe of the region (ND, NE and KS). Total rainfall was near or above the historical average at most sites. However, consistent with drought monitor reports, rainfall was below average in southwestern NE and eastern IL.
| Location | Water regime | Long-term average yield (bu/ac) § | Range of Yp forecasts as of Jul 16 (bu/ac)? 25th | Range of Yp forecasts as of Jul 16 (bu/ac)? 75th | Probability (%) of 2025 yield to be: BELOW (relative to the long-term Yp)† | Probability (%) of 2025 yield to be: NEAR (relative to the long-term Yp)† | Probability (%) of 2025 yield to be: ABOVE (relative to the long-term Yp)† | Simulated current crop stage* | |
|---|---|---|---|---|---|---|---|---|---|
| NE | Alliance | Irrigated | 230 | 229 | 264 | 3% | 42% | 56% | R1, Silking |
| NE | Beatrice | Dryland | 182 | 179 | 222 | 9% | 31% | 60% | R2, Blister |
| NE | Beatrice | Irrigated | 241 | 220 | 249 | 46% | 40% | 14% | R2, Blister |
| NE | Clay Center | Dryland | 188 | 187 | 233 | 16% | 30% | 53% | R1, Silking |
| NE | Clay Center | Irrigated | 258 | 252 | 280 | 12% | 51% | 37% | R2, Blister |
| NE | Concord | Dryland | 202 | 237 | 273 | 0% | 7% | 93% | R2, Blister |
| NE | Concord | Irrigated | 269 | 265 | 297 | 14% | 47% | 40% | R2, Blister |
| NE | Elgin | Irrigated | 268 | 255 | 293 | 19% | 49% | 32% | R1, Silking |
| NE | Holdrege | Dryland | 144 | 140 | 161 | 11% | 59% | 30% | R2, Blister |
| NE | Holdrege | Irrigated | 257 | 245 | 282 | 24% | 41% | 35% | R2, Blister |
| NE | McCook | Dryland | 119 | 74 | 125 | 56% | 23% | 21% | R2, Blister |
| NE | McCook | Irrigated | 238 | 221 | 252 | 33% | 40% | 28% | R2, Blister |
| NE | Mead | Dryland | 207 | 218 | 247 | 9% | 37% | 53% | R2, Blister |
| NE | Mead | Irrigated | 247 | 239 | 264 | 19% | 49% | 33% | R2, Blister |
| NE | North Platte | Dryland | 130 | 133 | 151 | 2% | 49% | 49% | R1, Silking |
| NE | North Platte | Irrigated | 256 | 241 | 276 | 33% | 26% | 42% | R1, Silking |
| NE | O'Neill | Irrigated | 247 | 243 | 281 | 12% | 40% | 48% | R1, Silking |
| IA | Ames | Dryland | 249 | 245 | 266 | 8% | 73% | 19% | R2, Blister |
| IA | Crawfordsville | Dryland | 238 | 246 | 263 | 3% | 71% | 26% | R2, Blister |
| IA | Kanawha | Dryland | 256 | 249 | 266 | 0% | 81% | 19% | R1, Silking |
| IA | Lewis | Dryland | 221 | 249 | 275 | 4% | 15% | 81% | R2, Blister |
| IA | Nashua | Dryland | 257 | 251 | 277 | 6% | 78% | 17% | R1, Silking |
| IA | Sutherland | Dryland | 245 | 262 | 289 | 0% | 36% | 64% | R1, Silking |
| IL | Bondville | Dryland | 252 | 227 | 261 | 27% | 64% | 9% | R2, Blister |
| IL | Freeport | Dryland | 242 | 231 | 264 | 11% | 66% | 23% | R1, Silking |
| IL | Olney | Dryland | 211 | 205 | 242 | 20% | 40% | 40% | R3, Milk |
| IL | Peoria | Dryland | 229 | 225 | 258 | 3% | 66% | 31% | R2, Blister |
| IL | Springfield | Dryland | 218 | 212 | 253 | 12% | 56% | 32% | R2, Blister |
| IN | Butlerville | Dryland | 238 | 228 | 258 | 0% | 77% | 23% | R1, Silking |
| IN | Columbia City | Dryland | 250 | 234 | 268 | 18% | 59% | 23% | V14 |
| IN | Davis | Dryland | 257 | 261 | 277 | 0% | 82% | 18% | V14 |
| IN | West Lafayette | Dryland | 254 | 248 | 270 | 5% | 77% | 18% | R2, Blister |
| KS | Garden City | Irrigated | 237 | 225 | 253 | 26% | 33% | 41% | R2, Blister |
| KS | Hutchinson | Dryland | 117 | 123 | 149 | 3% | 37% | 60% | R3, Milk |
| KS | Manhattan | Dryland | 159 | 169 | 187 | 0% | 40% | 60% | R4, Dough |
| KS | Scandia | Dryland | 157 | 170 | 201 | 0% | 28% | 72% | R3, Milk |
| KS | Scandia | Irrigated | 234 | 225 | 257 | 23% | 28% | 49% | R2, Blister |
| KS | Silverlake | Dryland | 163 | 128 | 183 | 46% | 23% | 31% | R3, Milk |
| KS | Silverlake | Irrigated | 218 | 218 | 249 | 15% | 18% | 67% | R3, Milk |
| MI | Ceresco | Dryland | 250 | 248 | 270 | 0% | 79% | 21% | V12 |
| MI | East Lansing | Dryland | 236 | 240 | 267 | 0% | 62% | 38% | V12 |
| MI | Munger | Dryland | 245 | 237 | 270 | 0% | 70% | 30% | V10 |
| MN | Eldred | Dryland | 164 | 147 | 191 | 28% | 34% | 38% | V12 |
| MN | Lamberton | Dryland | 246 | 256 | 281 | 0% | 54% | 46% | R1, Silking |
| MN | Waseca | Dryland | 247 | 269 | 295 | 0% | 31% | 69% | R1, Silking |
| MO | Brunswick | Dryland | 195 | 171 | 218 | 28% | 44% | 28% | R2, Blister |
| MO | Monroe City | Dryland | 192 | 179 | 213 | 17% | 50% | 33% | R2, Blister |
| MO | St Joseph | Dryland | 189 | 214 | 237 | 8% | 12% | 80% | R3, Milk |
| ND | Dazey | Dryland | 165 | 139 | 183 | 40% | 30% | 30% | V8 |
| OH | Custar | Dryland | 231 | 222 | 251 | 22% | 62% | 15% | R1, Silking |
| OH | South Charleston | Dryland | 235 | 239 | 265 | 3% | 54% | 43% | R1, Silking |
| OH | Wooster | Dryland | 236 | 227 | 259 | 8% | 68% | 25% | V10 |
§ Long-term (last 20+ years) potential yield at each location and surrounding area.
¶ Range of forecasted 2025 potential yields based on average planting date in 2025, indicating the potential yields in the 25th and 75th percentile of the potential yield distribution (associated with respective adverse and favorable weather scenarios during the rest of the season).
† Probability of obtaining a 2025 yield below (<-10%), near (±10%), and above (>10%) than the long-term potential yield at each dryland or irrigated (<-5%; ±5%; >5%) location.
Simulated Corn Stage Across 43 Locations
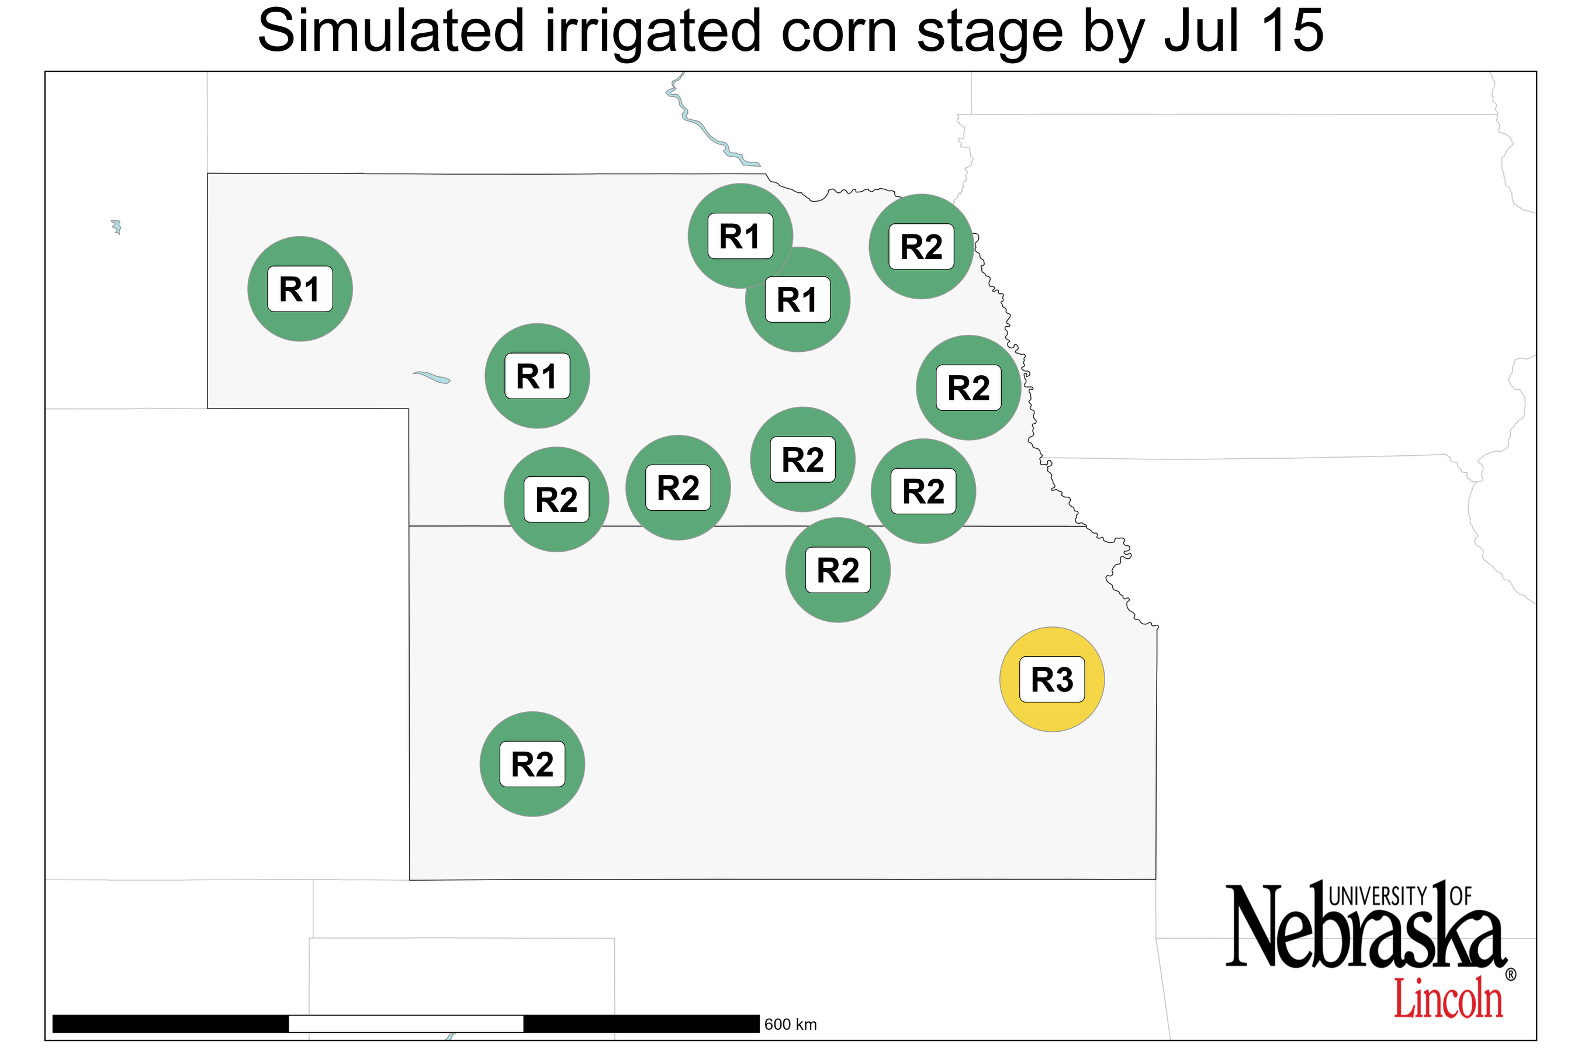
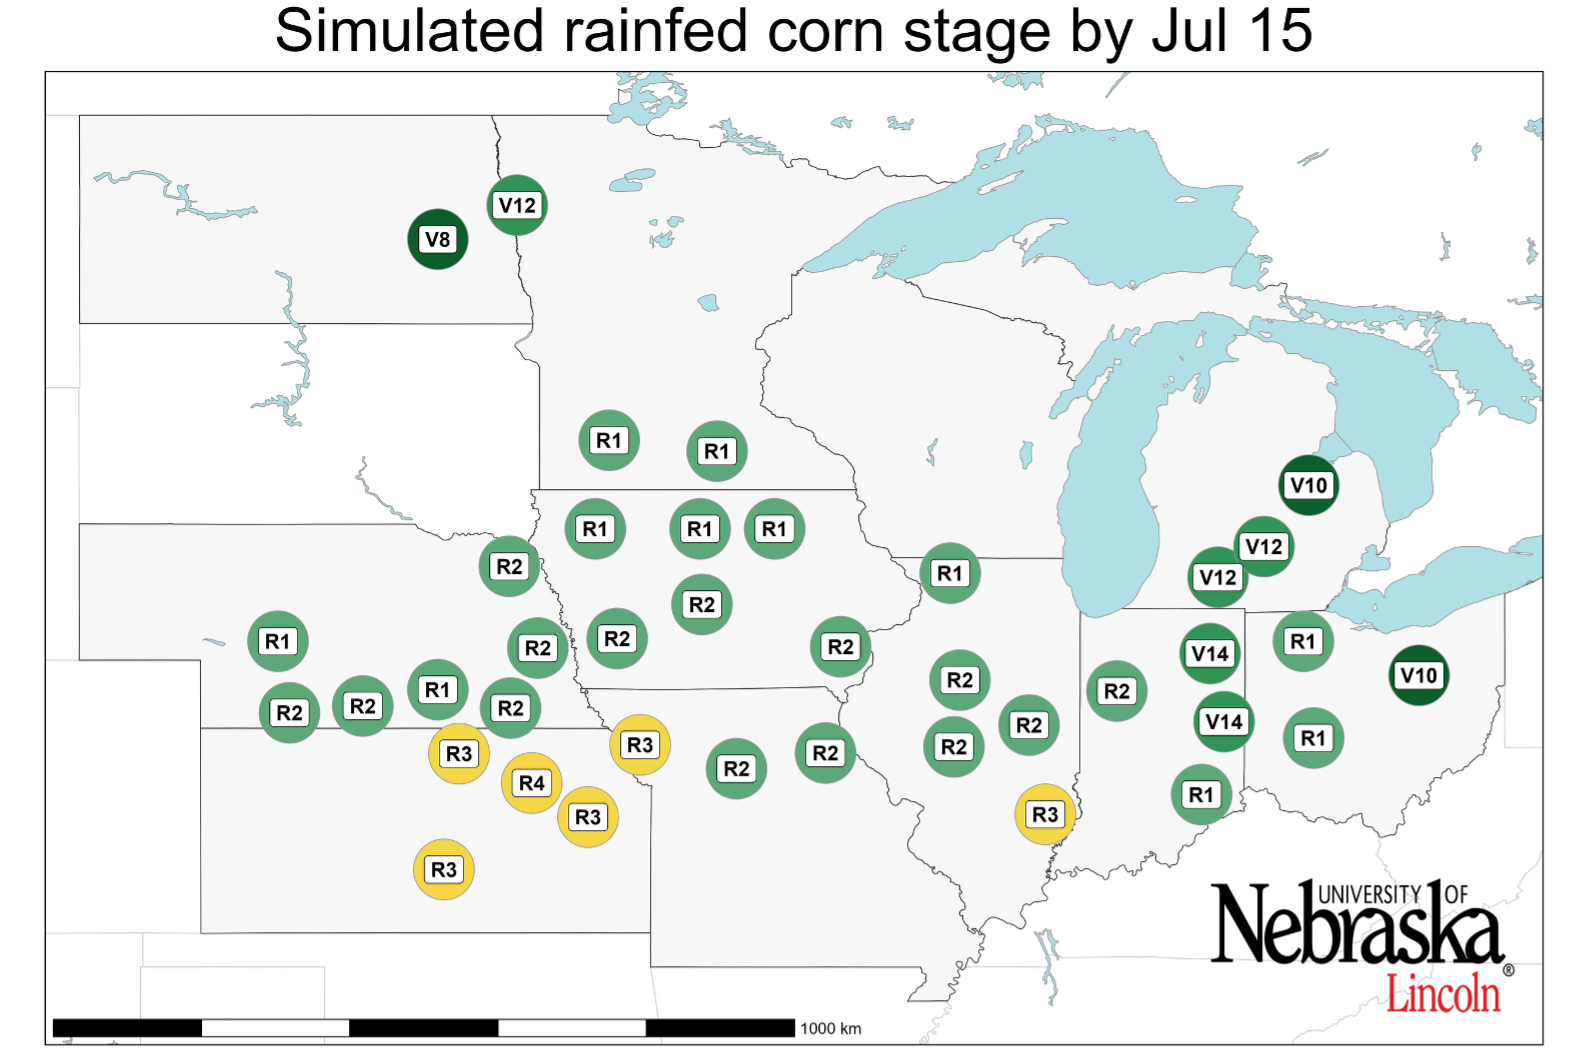
Corn has reached the 'silking' stage except for the northwestern (ND and northern MN) and eastern fringes of the region (MI and parts of IN and OH), where it is still in vegetative phases (Figure 2). Additionally, most sites in the southern part of the Corn Belt have reached the 'blister' stage (central and southern IL, southern NE, and MO) or even the 'milk' stage (KS).
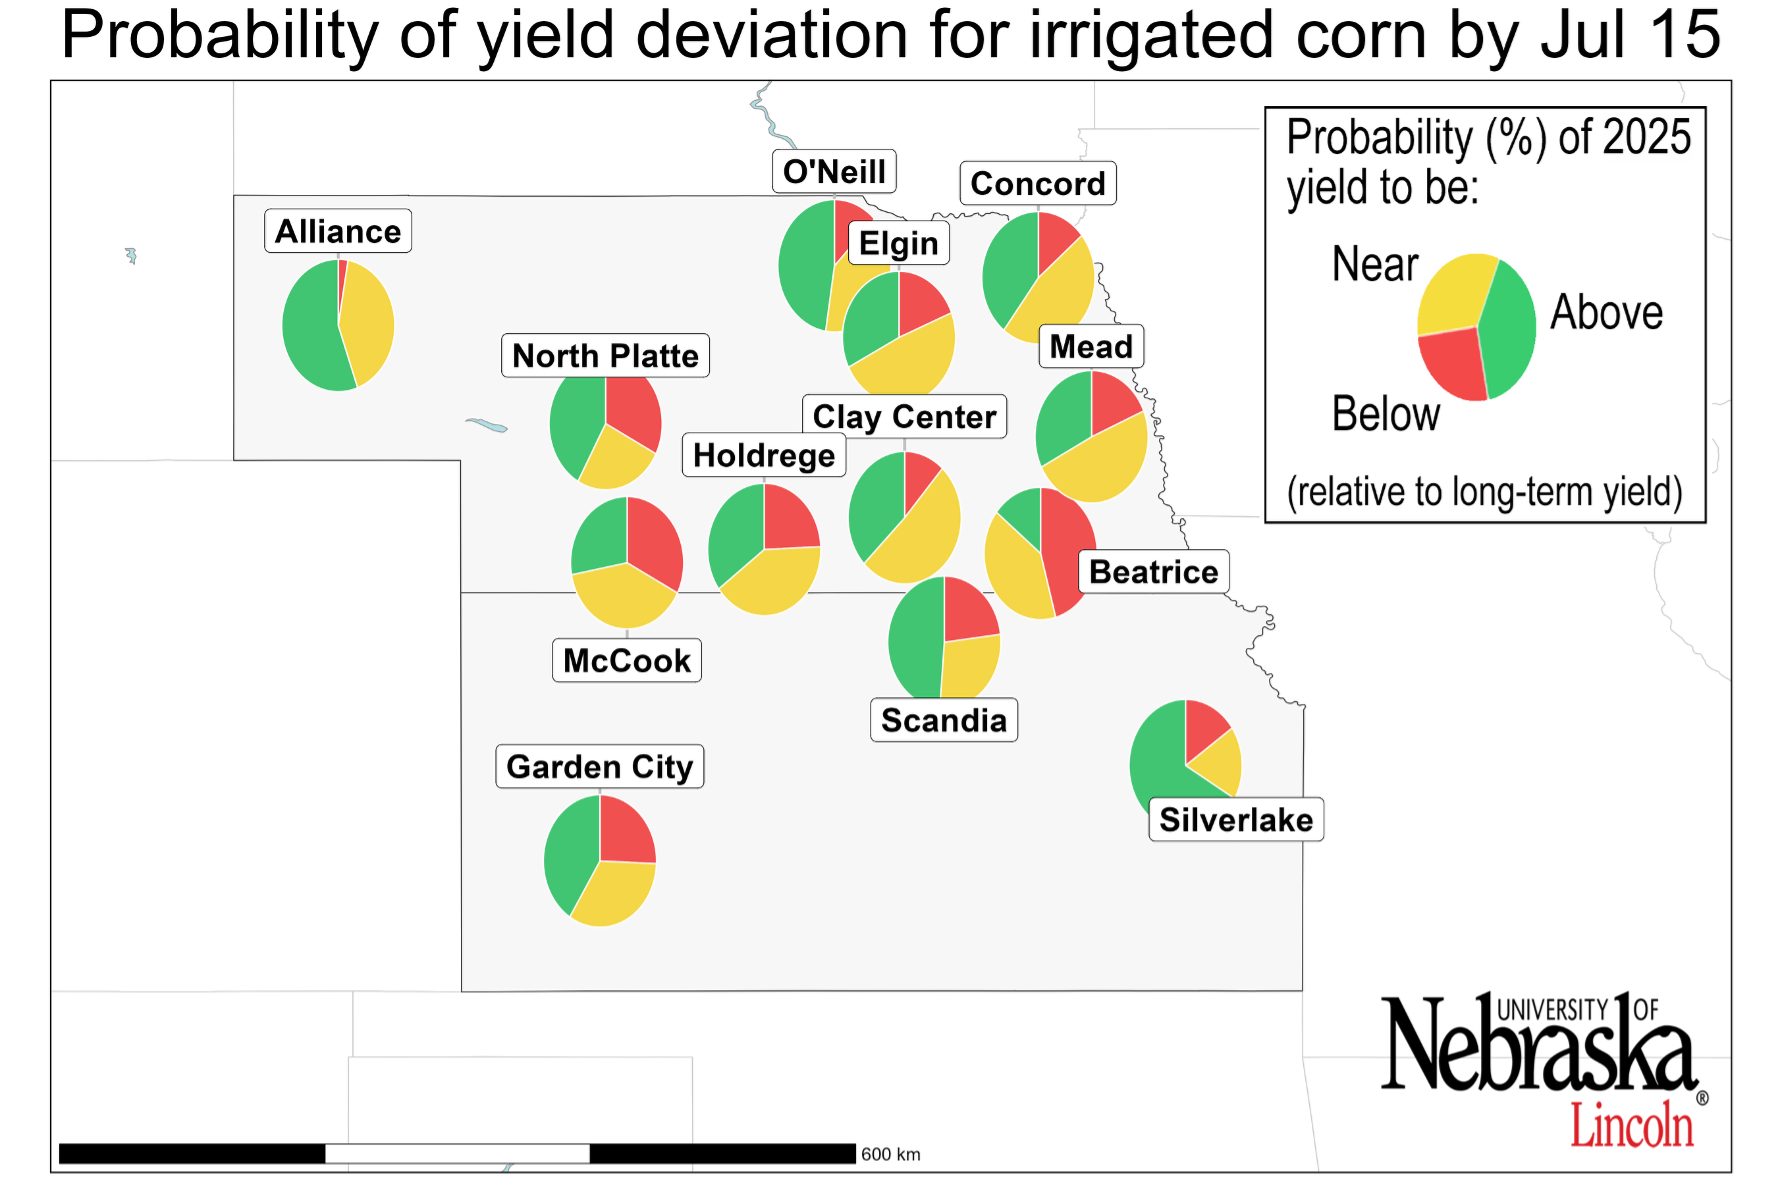
Irrigated Corn: High Probability of Near to Above-Average Yields
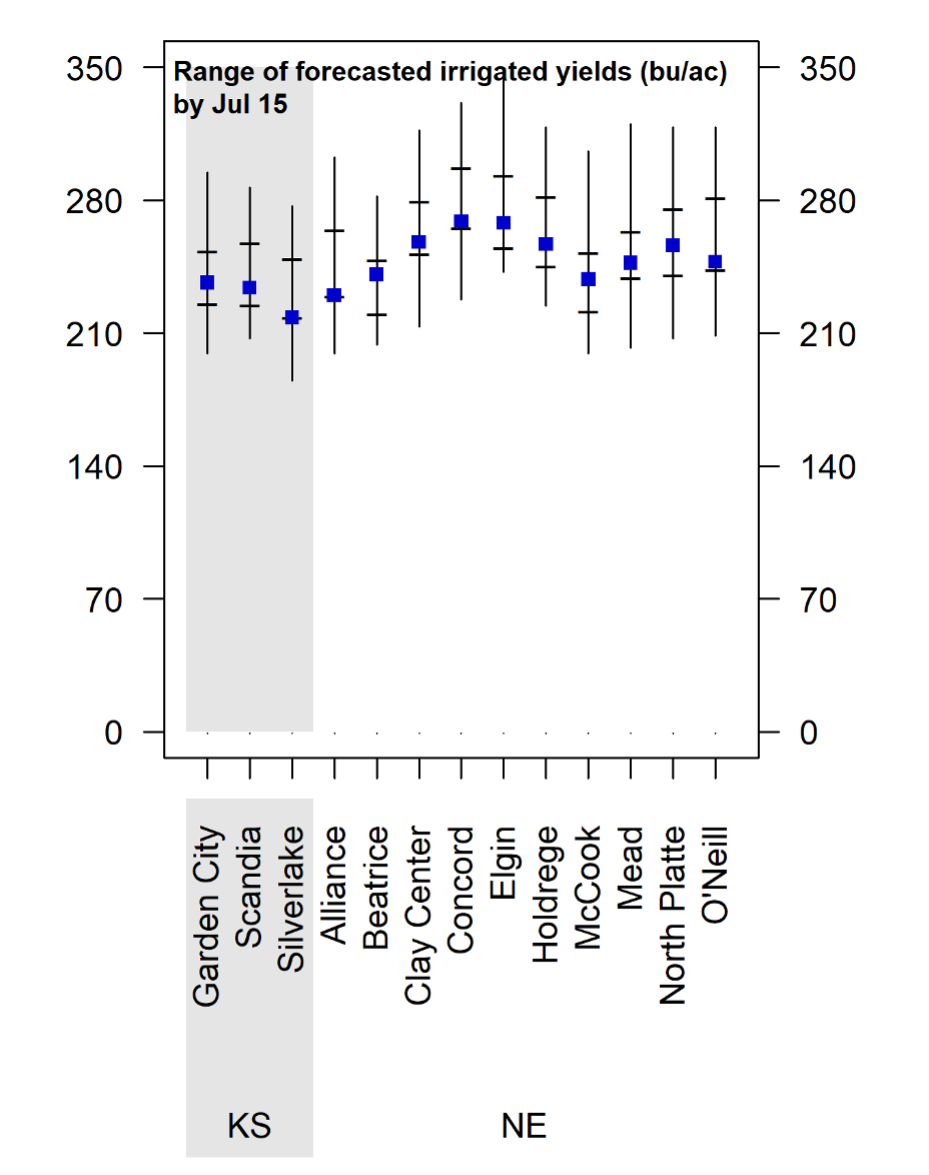
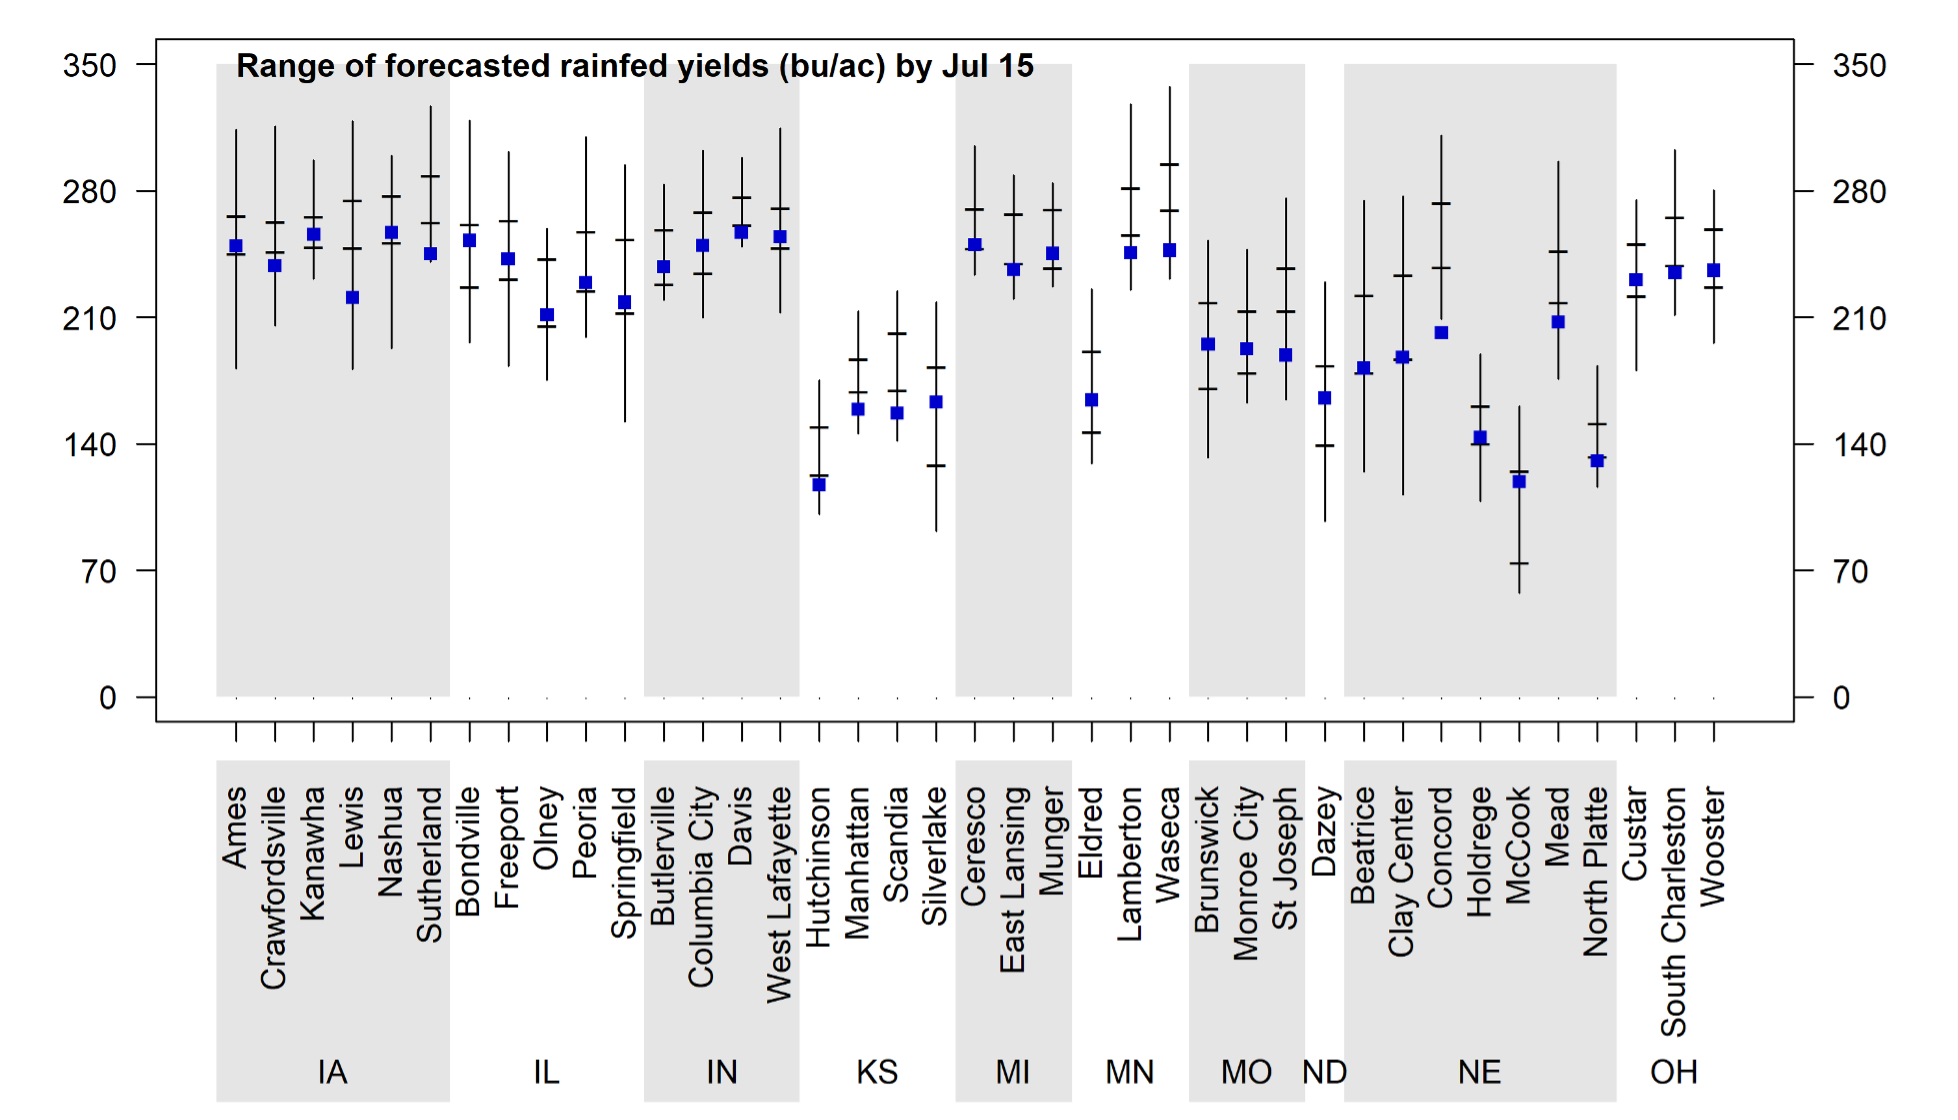
The range of forecasted irrigated corn yield potential for each location, as well as the probabilities for yields above, near or below-average are shown in Figures 3 and 4. Although it is still early in the season, there is a relatively low probability of below-average yields for most irrigated sites, with above-average yields more likely in KS and north and western NE. Weather conditions during the grain filling will ultimately determine if most irrigated sites achieve near or above-average yields.
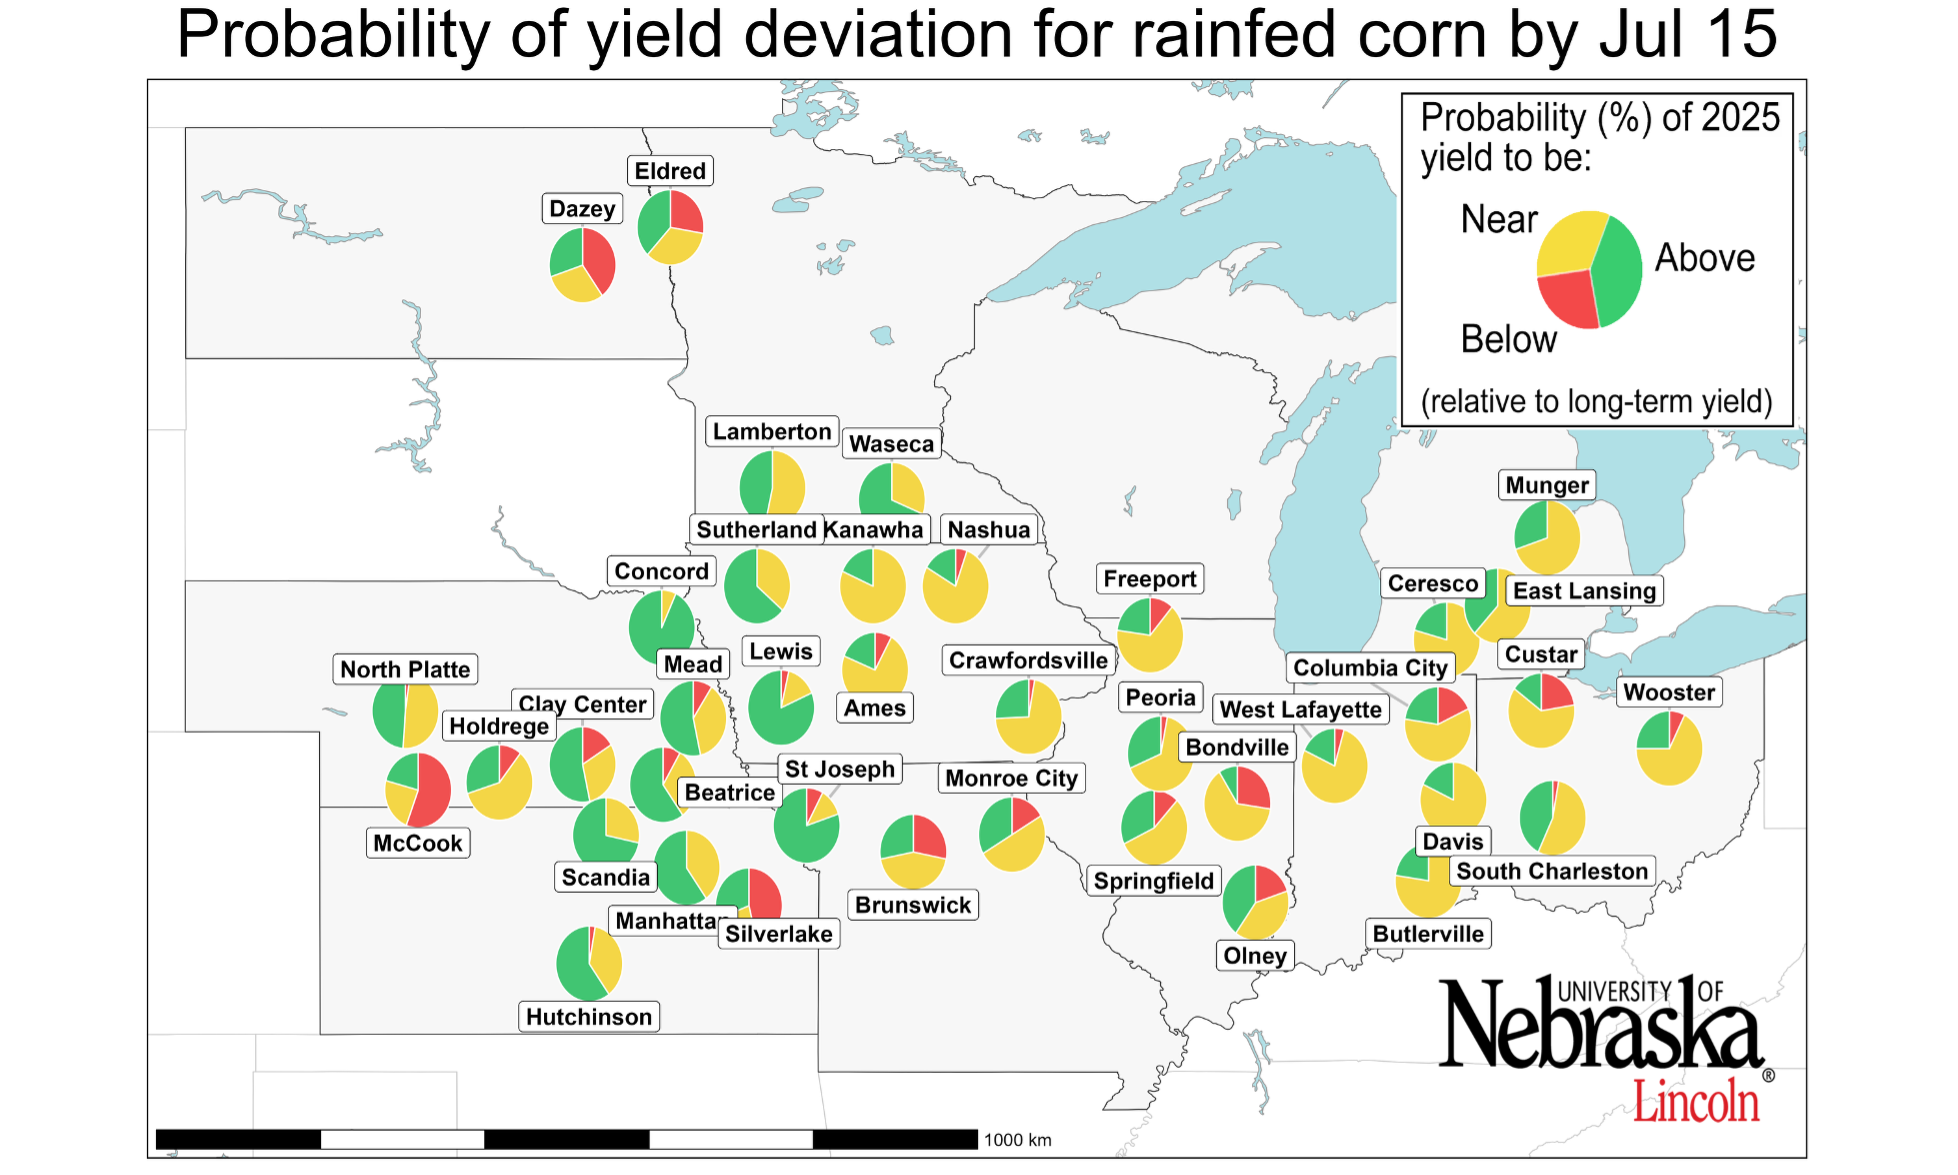
Near or Above Average Rainfed Corn Yield Forecasted in 2025
Forecasted yield potential seems to be either near or above average across almost all sites within the Corn Belt (Figures 3 and 4). Overall, at this point of the season, the probability of near-average yields is high from central to the eastern fringe of the region (central to eastern IA, IL, IN, MI and OH). Indeed, there is a high probability of near-average yields (>75%) in seven sites within that area, which is consistent with USDA NASS crop reports.
Conversely, the probability of above-average yields increases towards the western fringe of the Corn Belt (western IA, southern MN, southern and eastern NE, eastern KS, and northwestern MO). Finally, the probability of below-average yields appears to be low in almost the entire Corn Belt, except for one site in southwestern NE.
Whether these trends persist will depend on precipitation and temperature patterns during the rest of July and early August.
Conclusions
Corn has reached reproductive stages throughout most of the region. While it is still early to make strong inferences about end-of-season yields for irrigated corn, there is a relatively high probability of near-average yields for most sites, but this could change depending on temperatures during the next weeks.
For rainfed corn, the scenario is diverse across regions, with near-average yields likely in the central and eastern regions of the Corn Belt. However, above-average yields are expected in southern and eastern NE, KS, western IA, southern MN, and northwestern MO, whereas limited rainfall is leading to below-average yields in southwestern NE.
Temperature and rainfall through the end of July and early August will be crucial in determining whether these projections persist.
These forecasts do not take into consideration problems with stand emergence, hail/flooding damage, replanting situations, disease or nitrate leaching. In fields negatively affected by these constraints, actual yields will be lower than estimates provided here.
It is important to keep in mind that yield forecasts are not field specific and, instead, represent an estimate of average yield potential for a given location and surrounding area in absence of the yield-reducing factors mentioned here. Likewise, crop stages and forecasted yields will deviate from the ones reported here in fields with planting dates or hybrid maturities that differ markedly from those used as the basis for the forecasts. We will follow up with further forecasts in early August.
