This is the last article in a series that summarizes the simulated crop stages and yield forecasts across the Corn Belt. To evaluate, in “real-time,” the impact of this season’s weather on corn yield and its spatial variability across the Corn Belt, simulations of 2025 real-time crop stage were performed for 43 locations across the U.S. Corn Belt using the UNL Hybrid-Maize crop model; the data can be seen in Table 1. Details on the UNL Hybrid-Maize crop model and the underpinning methodology to simulate phenology and forecast end-of-season yields is described in a previous article.
Crop Stages and Weather Conditions During the Last Three Weeks
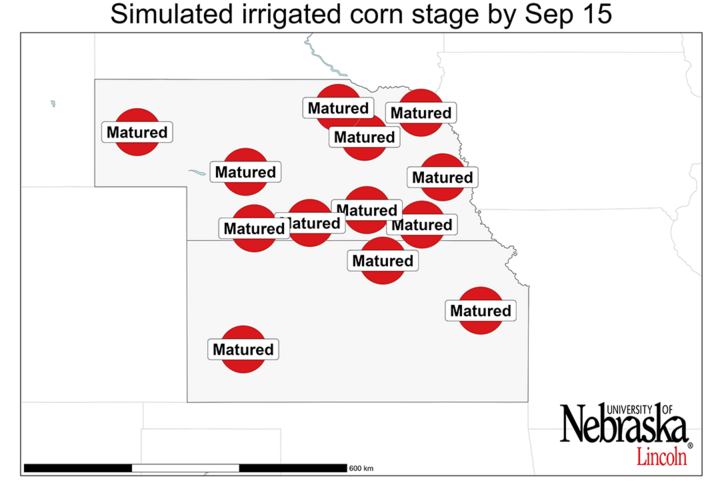
Corn has reached black layer stage at most of the sites, except for those located in northern and north-eastern fringes of the region, including ND, MN, MI, north of IA, and eastern IN and OH (Figure 2).
During the late grain filling, the western fringe of the Corn Belt (NE and KS) exhibited below-normal temperatures, which slowed down crop development towards the end of the crop season, extending grain filling for a few more days.
On the other hand, rainfall was below normal, except for a few locations in KS and NE where rainfall was above average. Indeed, most sites across ND, IA, IL, MO and OH received little or no rainfall during this period.
A summary of weather conditions during the past three weeks is shown in Figure 1.

| Location | Water regime | Long-term average yield (bu/ac) § | Range of Yp forecasts as of Sept. 16 (bu/ac)? 25th | Range of Yp forecasts as of Sept. 16 (bu/ac) 75th | Probability (%) of 2025 yield to be: Below | Probability (%) of 2025 yield to be: Near | Probability (%) of 2025 yield to be: Above | Simulated current crop stage* | |
|---|---|---|---|---|---|---|---|---|---|
| NE | Alliance | Irrigated | 230 | Black layer on Sept. 11. Final yield: 247 bu/ac | 247 | 0% | 0% | 100% | Matured |
| NE | Beatrice | Dryland | 182 | Black layer on Aug. 28. Final yield: 239 bu/ac | 239 | 0% | 0% | 100% | Matured |
| NE | Beatrice | Irrigated | 241 | Black layer on Aug. 26. Final yield: 242 bu/ac | 242 | 0% | 100% | 0% | Matured |
| NE | Clay Center | Dryland | 188 | Black layer on Sept. 11. Final yield: 244 bu/ac | 244 | 0% | 0% | 100% | Matured |
| NE | Clay Center | Irrigated | 258 | Black layer on Sept. 9. Final yield: 276 bu/ac | 276 | 0% | 0% | 100% | Matured |
| NE | Concord | Dryland | 202 | Black layer on Sept. 13. Final yield: 262 bu/ac | 262 | 0% | 0% | 100% | Matured |
| NE | Concord | Irrigated | 269 | 284 | 285 | 0% | 14% | 86% | R6, Blacklayer |
| NE | Elgin | Irrigated | 268 | Black layer on Sept. 12. Final yield: 285 bu/ac | 285 | 0% | 0% | 100% | Matured |
| NE | Holdrege | Dryland | 144 | Black layer on Aug. 30. Final yield: 153 bu/ac | 153 | 0% | 100% | 0% | Matured |
| NE | Holdrege | Irrigated | 257 | Black layer on Sept. 7. Final yield: 271 bu/ac | 271 | 0% | 0% | 100% | Matured |
| NE | McCook | Dryland | 119 | Black layer on Aug. 20. Final yield: 96 bu/ac | 96 | 100% | 0% | 0% | Matured |
| NE | McCook | Irrigated | 238 | Black layer on Aug. 23. Final yield: 229 bu/ac | 229 | 0% | 100% | 0% | Matured |
| NE | Mead | Dryland | 207 | Black layer on Sept. 8. Final yield: 252 bu/ac | 252 | 0% | 0% | 100% | Matured |
| NE | Mead | Irrigated | 247 | Black layer on Sept. 2. Final yield: 268 bu/ac | 268 | 0% | 0% | 100% | Matured |
| NE | North Platte | Dryland | 130 | Black layer on Sept. 11. Final yield: 150 bu/ac | 150 | 0% | 0% | 100% | Matured |
| NE | North Platte | Irrigated | 256 | Black layer on Sept. 12. Final yield: 256 bu/ac | 256 | 0% | 100% | 0% | Matured |
| NE | O'Neill | Irrigated | 247 | Black layer on Sept. 13. Final yield: 263 bu/ac | 263 | 0% | 0% | 100% | Matured |
| IA | Ames | Dryland | 249 | Black layer on Sept. 1. Final yield: 256 bu/ac | 256 | 0% | 100% | 0% | Matured |
| IA | Crawfordsville | Dryland | 238 | Black layer on Aug. 30. Final yield: 255 bu/ac | 255 | 0% | 100% | 0% | Matured |
| IA | Kanawha | Dryland | 256 | 249 | 254 | 0% | 100% | 0% | R5, Dent |
| IA | Lewis | Dryland | 221 | Black layer on Sept. 6. Final yield: 280 bu/ac | 280 | 0% | 0% | 100% | Matured |
| IA | Nashua | Dryland | 257 | 261 | 269 | 0% | 100% | 0% | R5, Dent |
| IA | Sutherland | Dryland | 245 | Black layer on Sept. 13. Final yield: 274 bu/ac | 274 | 0% | 0% | 100% | Matured |
| IL | Bondville | Dryland | 252 | Black layer on Aug. 29. Final yield: 215 bu/ac | 215 | 100% | 0% | 0% | Matured |
| IL | Freeport | Dryland | 242 | Black layer on Sept. 13. Final yield: 247 bu/ac | 247 | 0% | 100% | 0% | Matured |
| IL | Olney | Dryland | 211 | Black layer on Aug. 17. Final yield: 206 bu/ac | 206 | 0% | 100% | 0% | Matured |
| IL | Peoria | Dryland | 229 | Black layer on Aug. 31. Final yield: 253 bu/ac | 253 | 0% | 0% | 100% | Matured |
| IL | Springfield | Dryland | 218 | Black layer on Aug. 20. Final yield: 221 bu/ac | 221 | 0% | 100% | 0% | Matured |
| IN | Butlerville | Dryland | 238 | Black layer on Sept. 9. Final yield: 247 bu/ac | 247 | 0% | 100% | 0% | Matured |
| IN | Columbia City | Dryland | 250 | 274 | 295 | 0% | 32% | 68% | R5, Dent |
| IN | Davis | Dryland | 257 | 283 | 299 | 0% | 27% | 73% | R5, Dent |
| IN | West Lafayette | Dryland | 254 | Black layer on Sept. 8. Final yield: 283 bu/ac | 283 | 0% | 0% | 100% | Matured |
| KS | Garden City | Irrigated | 237 | Black layer on Aug. 21. Final yield: 221 bu/ac | 221 | 100% | 0% | 0% | Matured |
| KS | Hutchinson | Dryland | 117 | Black layer on Aug. 12. Final yield: 142 bu/ac | 142 | 0% | 0% | 100% | Matured |
| KS | Manhattan | Dryland | 159 | Black layer on Aug. 11. Final yield: 175 bu/ac | 175 | 0% | 0% | 100% | Matured |
| KS | Scandia | Dryland | 157 | Black layer on Aug. 20. Final yield: 191 bu/ac | 191 | 0% | 0% | 100% | Matured |
| KS | Scandia | Irrigated | 234 | Black layer on Aug. 24. Final yield: 249 bu/ac | 249 | 0% | 0% | 100% | Matured |
| KS | Silverlake | Dryland | 163 | Black layer on Aug. 14. Final yield: 187 bu/ac | 187 | 0% | 0% | 100% | Matured |
| KS | Silverlake | Irrigated | 218 | Black layer on Aug. 16. Final yield: 237 bu/ac | 237 | 0% | 0% | 100% | Matured |
| MI | Ceresco | Dryland | 250 | 257 | 285 | 0% | 46% | 54% | R5, Dent |
| MI | East Lansing | Dryland | 236 | 253 | 278 | 0% | 34% | 66% | R5, Dent |
| MI | Munger | Dryland | 245 | 268 | 285 | 0% | 30% | 70% | R5, Dent |
| MN | Eldred | Dryland | 164 | 198 | 218 | 0% | 7% | 93% | R5, Dent |
| MN | Lamberton | Dryland | 246 | 274 | 281 | 0% | 7% | 93% | R5, Dent |
| MN | Waseca | Dryland | 247 | 284 | 296 | 0% | 4% | 96% | R5, Dent |
| MO | Brunswick | Dryland | 195 | Black layer on Aug. 24. Final yield: 216 bu/ac | 216 | 0% | 0% | 100% | Matured |
| MO | Monroe City | Dryland | 192 | Black layer on Aug. 26. Final yield: 204 bu/ac | 204 | 0% | 100% | 0% | Matured |
| MO | St Joseph | Dryland | 189 | Black layer on Aug. 20. Final yield: 232 bu/ac | 232 | 0% | 0% | 100% | Matured |
| ND | Dazey | Dryland | 165 | 139 | 166 | 30% | 53% | 17% | R4, Dough |
| OH | Custar | Dryland | 231 | Black layer on Sept. 3. Final yield: 214 bu/ac | 220 | 0% | 100% | 0% | Matured |
| OH | South Charleston | Dryland | 235 | Black layer on Sept. 12. Final yield: 260 bu/ac | 260 | 0% | 0% | 100% | Matured |
| OH | Wooster | Dryland | 236 | 224 | 251 | 8% | 80% | 12% | R4, Dough |
§ Long-term (last 20-plus years) potential yield at each location and surrounding area.
¶ Range of forecasted 2025 potential yields based on average planting date in 2025, indicating the potential yields in the 25th and 75th percentile of the potential yield distribution (associated with respective adverse and favorable weather scenarios during the rest of the season).
† Probability of obtaining a 2025 yield below (<-10%), near (±10%), and above (>10%) than the long-term potential yield at each location.

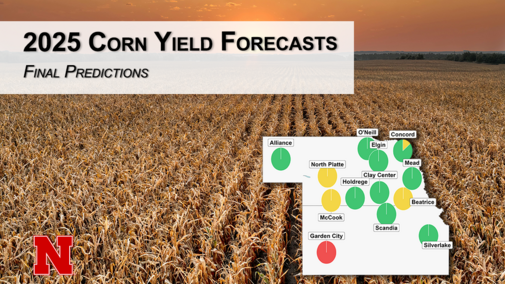
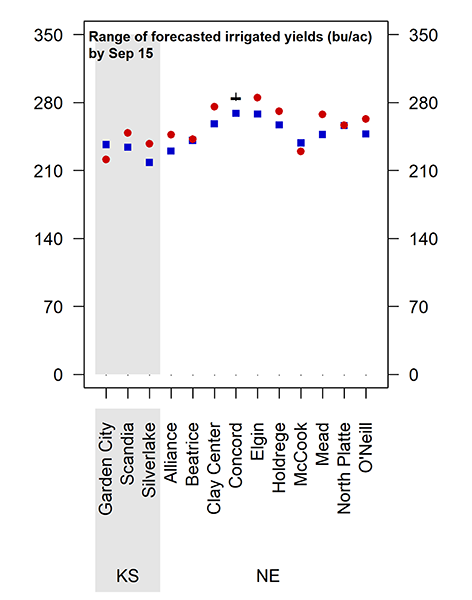
Near to Above-Average Yields in Irrigated Corn
Forecasted end-of-season irrigated yields are shown in Figure 3 and 4. Most irrigated sites (nine out of 13) exhibited above-average yields. Cooler weather over the past three weeks have increased the forecasted irrigated yield compared with our previous forecast and also relative to the previous (2024) season.
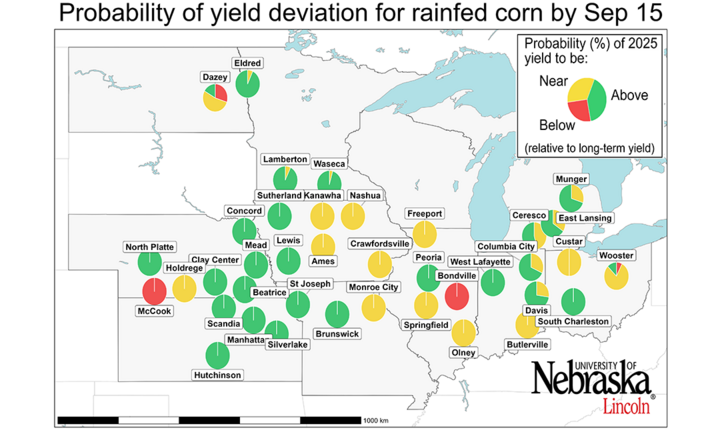
Rainfed Corn: Near-To-Above Average Yields Across Rainfed Sites
There is a high probability of near to above-average yields for most sites. Overall, 49% of the sites (19 out of 39) are projected to achieve-above average yields, while 31% (12 out of 39) are expected to obtain near-average yields. Above-average yields are mostly expected in sites located in MN, NE, KS, western MO and western IA (Figures 3 and 4).
Conversely, only two sites (western NE and eastern IL) exhibited below-average yields. Compared to our previous forecast, the predicted yield has increased in the eastern fringe of the Corn Belt (IL, IN, MI and OH) due to a combination of high irradiance and low night-time temperatures during the late grain-filling period.
The forecasted dryland yield for 2025 is higher than for the previous (2024) season and above the long-term average.


Conclusions
Aggregated at regional level, our forecasted yield potential this season is 8% above the long-term average. Our forecast suggests above-average yields for the majority of irrigated sites. For rainfed corn, most sites (80%) expect near or above-average yields.
Note that these forecasts do not take into consideration problems with stand emergence, hail/flooding damage, replanting situations, disease or nitrate leaching. In fields negatively affected by these constraints, actual yields will be lower than estimates provided here.
It is important to keep in mind that yield forecasts are not field specific and, instead, represent an estimate of average on-farm yield for a given location and surrounding area in absence of the yield-reducing factors mentioned here. Likewise, crop stages and forecasted yields will deviate from those reported here in fields with planting dates or hybrid maturities that differ markedly from those used as the basis for these forecasts.
