
Key Takeaways
Decision Support: The Yield Forecasting Center can help producers with yield goal adjustments, irrigation and fertilization timing, pest control and guide marketing decisions.
Regional Coverage: Forecasts will be issued for 43 Corn Belt locations, with separate predictions for rainfed and irrigated corn.
Collaborative, Research-Based Approach: UNL researchers work with agronomists and extension educators across the Corn Belt using local crop data, soil types and real-time weather to drive forecasts.
Powered by Hybrid-Maize: Forecasts are generated using UNL’s crop simulation model, which estimates corn yield potential considering 2025 average planting dates and optimal management.
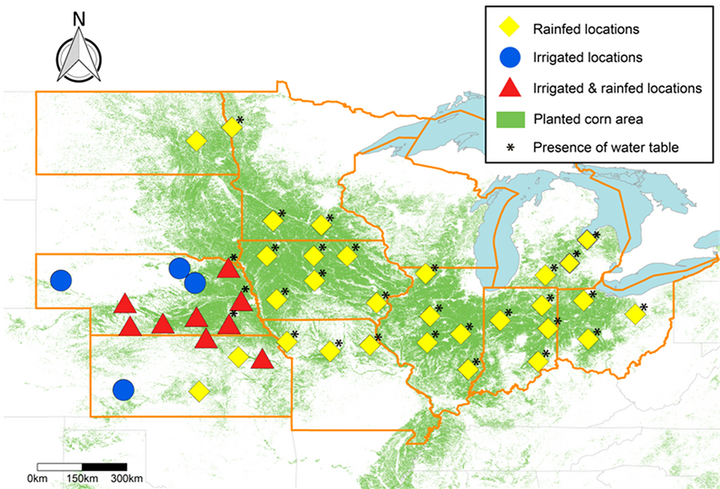
The Yield Forecasting Center (YFC) will provide real-time information on corn phenology and forecasts of corn yield potential every three weeks, starting in mid-July, to aid growers and ag industry in making management, logistics and marketing decisions through the 2025 season. The YFC platform consists of a core team at UNL in collaboration with agronomists and extension educators from universities throughout the Corn Belt. Forecasts will be provided for 43 locations, including separate forecasts for rainfed and irrigated corn in regions where both irrigated and rainfed production are important, such as in Nebraska and Kansas (Figure 1 below). This article summarizes the methodologies used in the YFC to forecast corn phenology and yield and provides guidelines for interpreting the results.
The Approach
The YFC relies on:
- A network of collaborators providing local management data and verifying forecasted yields,
- Precise information on dominant soil types in each region,
- Measured high-quality, real time weather data, and
- a well-validated crop simulation model (UNL Hybrid Maize).
More information about data sources and modeling can be found at the Global Yield Gap Atlas website.
Local agronomists and extension educators provide information on management in each state and help validate and interpret the forecasts. Information provided by collaborators includes site-specific average planting date (i.e., average calendar date at which 50% of the corn area was planted in the current season), plant density, and hybrid maturity (Table 1).
When both rainfed and irrigated production occurs at a location, separate sets of management practices are used for simulating rainfed and irrigated crops at those sites because water regime has a large influence on production practices. Management data have been further validated using information provided by DuPont Pioneer agronomists, especially with regard to hybrid maturity and plant density.
Yield forecasts are based on the two to three dominant soil types at each location. Yield is forecasted separately for each soil type. Yield predictions are subsequently aggregated by averaging the forecasts across soil types, after weighting them according to prevalence of each soil type in each location (Table 2).
| Location | Water regime | Density (plants/acre) | Hybrid RM (days) | 2025 planting date‡ |
|---|---|---|---|---|
| Alliance, NE | Irrigated | 35,000 | 95 | 7-May |
| North Platte, NE | Irrigated | 35,000 | 110 | 4-May |
| Dryland | 16,000 | 105 | 7-May | |
| McCook, NE | Irrigated | 35,000 | 110 | 1-May |
| Dryland | 16,000 | 105 | 14-May | |
| Holdrege, NE | Irrigated | 35,000 | 113 | 30-Apr |
| Dryland | 18,000 | 105 | 1-May | |
| Clay Center, NE | Irrigated | 35,000 | 113 | 28-Apr |
| Dryland | 27,000 | 113 | 3-May | |
| Beatrice, NE | Irrigated | 35,000 | 114 | TBD |
| Dryland | 30,000 | 113 | TBD | |
| Mead, NE | Irrigated | 35,000 | 113 | 25-Apr |
| Dryland | 28,000 | 113 | 5-May | |
| Concord, NE | Irrigated | 35,000 | 111 | 25-Apr |
| Dryland | 27,000 | 110 | 25-Apr | |
| Elgin, NE | Irrigated | 35,000 | 113 | 28-Apr |
| ONeil, NE | Irrigated | 34,000 | 108 | TBD |
| Manhattan, KS | Dryland | 26,000 | 110 | 22-Apr |
| Scandia, KS | Irrigated | 35,000 | 116 | 21-Apr |
| Dryland | 25,000 | 107 | 24-Apr | |
| Silverlake, KS | Irrigated | 35,000 | 117 | 21-Apr |
| Dryland | 25,000 | 109 | 24-Apr | |
| Hutchinson, KS | Dryland | 21,000 | 105 | 26-Apr |
| Garden City, KS | Irrigated | 35,000 | 113 | 1-May |
| Lamberton, MN | Dryland | 33,000 | 101 | 4-May |
| Waseca, MN | Dryland | 35,000 | 103 | 8-May |
| Eldred, MN | Dryland | 28,000 | 82 | 9-May |
| Dazey, ND | Dryland | 28,000 | 82 | 15-May |
| St Joseph, MO | Dryland | 30,000 | 112 | 24-Apr |
| Brunswick, MO | Dryland | 30,000 | 112 | 27-Apr |
| Monroe City, MO | Dryland | 30,000 | 111 | 30-Apr |
| Ames, IA | Dryland | 35,000 | 109 | 4-May |
| Crawfordsville, IA | Dryland | 35,000 | 113 | 29-Apr |
| Kanawha, IA | Dryland | 36,000 | 101 | 6-May |
| Lewis, IA | Dryland | 34,000 | 113 | 2-May |
| Nashua, IA | Dryland | 35,000 | 101 | 9-May |
| Sutherland, IA | Dryland | 35,000 | 103 | 27-Apr |
| Bondville, IL | Dryland | 34,000 | 113 | 9-May |
| Freeport, IL | Dryland | 35,000 | 103 | 9-May |
| Olney, IL | Dryland | 30,000 | 113 | 9-May |
| Peoria, IL | Dryland | 34,000 | 113 | 7-May |
| SpringField, IL | Dryland | 36,000 | 113 | 5-May |
| Butlerville, IN | Dryland | 33,000 | 113 | 22-May |
| Columbia City, IN | Dryland | 33,000 | 108 | 30-May |
| Davis, IN | Dryland | 34,000 | 108 | 27-May |
| West Lafayette, IN | Dryland | 34,000 | 113 | 2-May |
| Custar, OH | Dryland | 34,000 | 108 | 22-May |
| South Charleston, OH | Dryland | 34,000 | 112 | 17-May |
| Wooster, OH | Dryland | 33,000 | 106 | 27-May |
| East Lansing, MI | Dryland | 32,000 | 100 | 15-May |
| Munger, MI | Dryland | 32,000 | 97 | 20-May |
| Ceresco, MI | Dryland | 33,000 | 105 | 12-May |
† Data were retrieved by state collaborators.
‡ Approximate date at which 50% of final corn area was planted in 2025 at each location. Soil water balance was initialized around prior crop harvest in the previous year (2024), assuming 50% available soil water. TBD: still to be determined.
| Location | Soil 1 | Soil 2 | Soil 3 | Water table coverage (%) * |
|---|---|---|---|---|
| (top- & sub-soil texture) ‡ | (top- & sub-soil texture) | (top- & sub-soil texture) | ||
| Ames, IA | silt loam - silt loam (18%) | clay loam - silt loam (12%) | silt clay loam - silt clay loam (7%) | 63 |
| Beatrice, NE | silt clay loam - silt clay loam (48%) | silty clay - silt clay loam (14%) | silt loam - silt loam (13%) | 14 |
| Bondville, IL | silt clay loam - silt loam (14%) | silt loam - silt clay loam (13%) | silt clay loam - silt clay loam (12%) | 61 |
| Butlerville, IN | silt loam - silt loam (64%) | silt loam - silt clay loam (10%) | 26 | |
| Ceresco, MI | sandy loam - sandy loam (27%) | silt loam - silt loam (25%) | silt loam - sandy loam (17%) | 31 |
| Clay Center, NE | silt loam - silt clay loam (46%) | silt loam - silt loam (33%) | silt clay loam - silt clay loam (21%) | 0 |
| Columbia City, IN | silt clay loam - silty clay (13%) | silt clay loam - clay loam (11%) | silt loam - silt loam (11%) | 65 |
| Concord, NE | silt loam - silt loam (46%) | silt clay loam - silt clay loam (29%) | - | 25 |
| Crawfordsville, IA | silt loam - silt clay loam (23%) | silt clay loam - silt clay loam (20%) | silt loam - silt loam (8%) | 49 |
| Custar, OH | clay loam - clay (10%) | clay loam - clay loam (7%) | silt loam - clay loam (6%) | 79 |
| Davis, IN | silt loam - silt loam (21%) | silt clay loam - silty clay (8%) | silt loam - silt clay loam (7%) | 64 |
| Dazey, ND | silt loam - silt loam (100%) | - | - | 0 |
| Eldred, MN | silt clay loam - silt clay loam (36%) | silty clay - silty clay (34%) | silt loam - silt loam (25%) | 5 |
| Freeport, IL | silt loam - silt loam (38%) | silt loam - silt clay loam (35%) | - | 27 |
| Holdrege, NE | silt loam - silt loam (100%) | - | - | 0 |
| Hutchinson, KS | silt clay loam - silt clay loam (44%) | silt loam - silt loam (33%) | silt loam - silt clay loam (23%) | 0 |
| Kanawha, IA | clay loam - silt loam (18%) | silt loam - silt loam (9%) | 73 | |
| Lamberton, MN | clay loam - silt loam (20%) | silt loam - silt loam (20%) | 60 | |
| Lewis, IA | silt clay loam - silt clay loam (48%) | silt loam - silt loam (11%) | - | 41 |
| Manhattan, KS | silt clay loam - silt clay loam (41%) | silt clay loam - silty clay (32%) | silt loam - silt loam (27%) | 0 |
| McCook, NE | silt loam - silt loam (100%) | - | - | 0 |
| Mead, NE | silt clay loam - silt clay loam (35%) | silt loam - silt loam (28%) | silt clay loam - silt loam (12%) | 25 |
| Monroe City, MO | silt loam - silty clay (37%) | silt loam - silt clay loam (31%) | silt clay loam - silt clay loam (23%) | 9 |
| Nashua, IA | silt loam - silt loam (24%) | silt clay loam - silt loam (12%) | 64 | |
| North Platte, NE | silt loam - silt loam (100%) | - | - | 0 |
| Olney, IL | silt loam - silt clay loam (47%) | silt loam - silt loam (39%) | 14 | |
| Peoria, IL | silt loam - silt clay loam (24%) | silt clay loam - silt clay loam (8%) | silt loam - silt loam (7%) | 61 |
| Scandia, KS | silt clay loam - silt clay loam (51%) | silt loam - silt clay loam (26%) | silt loam - silt loam (23%) | 0 |
| Silverlake, KS | silt clay loam - silt clay loam (38%) | silt loam - silt loam (31%) | silt clay loam - silty clay (31%) | 0 |
| South Charleston, OH | silt loam - silt loam (27%) | silt loam - clay loam (16%) | clay loam - clay loam (10%) | 47 |
| Springfield, IL | silt loam - silt clay loam (51%) | silt clay loam - silt clay loam (19%) | 60 | |
| St Joseph, MO | silt clay loam - silt clay loam (47%) | silt loam - silt loam (26%) | silt loam - silt clay loam (12%) | 15 |
| Sutherland, IA | silt clay loam - silt loam (22%) | silt clay loam - silt clay loam (18%) | silt loam - silt loam (14%) | 46 |
| Waseca, MN | silt loam - silt loam (27%) | clay loam - silt loam (17%) | 56 | |
| West Lafayette, IN | silt loam - silt loam (31%) | silt clay loam - silt loam (7%) | silt clay loam - silt clay loam (5%) | 57 |
| Wooster, OH | silt loam - silt clay loam (25%) | silt loam - silt loam (22%) | 53 |
† Data were retrieved from GSSURGO soil database (NRCS, Soil Division). Only soils under dryland crop cultivation were considered. Soil data were used only for rainfed corn simulations (soil data were not needed for simulation of irrigated crops).
‡ Soil texture in the topsoil (0-1 ft) and subsoil (2-4 ft) and associated prevalence of each soil type (in %) at each location. (source: Global Yield Gap Atlas; www.yieldgap.org).
* Water table coverage was inferred from the most recent data on subsurface tile drainage reported by US Census of Agriculture (USDA-NASS, 2012).
Historical (last 20-plus years) and real-time daily weather data are used for phenology and yield forecasting. Daily weather variables required for simulating real-time crop growth and development include solar radiation, maximum and minimum temperature, precipitation, relative humidity, and wind speed.
The YFC relies on measured data collected through state weather networks (Figure 1), including:
- High Plains Regional Climate Center (HPRCC)
- National Weather Service station network (NWS)
- Illinois Water and Atmospheric Resources Monitoring Program (WARM)
- Ohio State University’s Ohio Agricultural Research and Development Center Weather Service (OARDC)
- Indiana Purdue Automated Agricultural Weather Station Network (PAAWS)
- Southern Research and Outreach Center (SROC) and Southwest Research and Outreach Center (SWROC) from the University of Minnesota
- Missouri Mesonet (AgEBB)
- North Dakota Agricultural Weather Network (NDAWN)
- Michigan State University Enviro-Weather
Weather stations selected from these networks are located in agricultural areas, rather than in urban areas, which helps to ensure the representativeness of the weather data for forecasting corn yields and phenology. Details on the data inputs used as basis for the forecasts are available in Morell et al (2016).
Hybrid-Maize is a corn simulation model developed by UNL researchers that simulates daily corn growth and development and final grain yield under irrigated and rainfed conditions. The model estimates "yield potential", which is the yield obtained when the crop is not limited by nutrient supply, diseases, insect pressure or weed competition — conditions that represent an "optimal management" scenario.
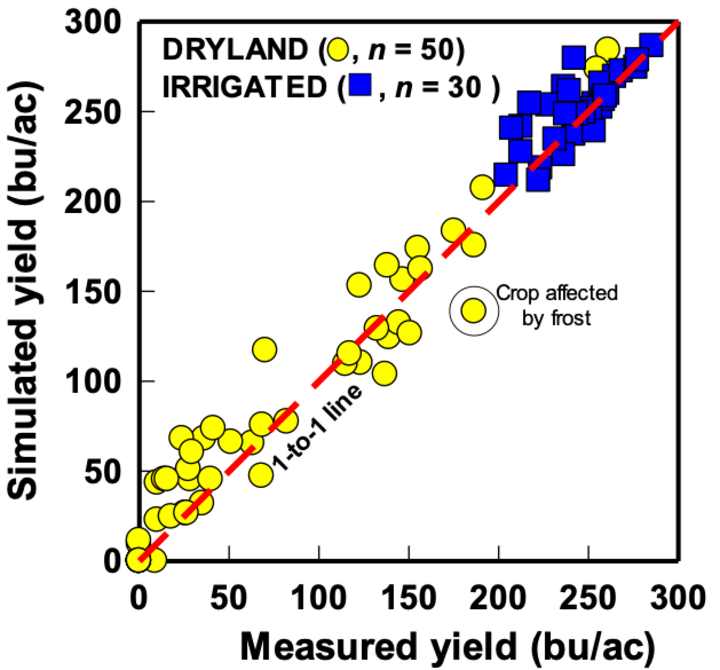
In rainfed scenarios, soil water balance was initialized around prior crop harvest in the previous year (2023), assuming 50% available soil water. It also assumes uniform plant stand at the specified plant population and no problems of flooding or hail. Although the model can account for drought stress and high temperatures during vegetative growth and the grain filling, it will unlikely portray well crop yield in two situations: (1) a season when a crop suffers very severe heat and drought stress during the silking and pollination (i.e., flowering) window of about seven days, and (2) when an early frost kills the crop well before grain filling is completed.
However, even with these relatively uncommon provisos, the model has been successfully evaluated across a wide range of environments where corn produced yields varying from near zero up to 300 bu/ac (Figure 2). More details on Hybrid-Maize model are available in Yang et al (2017).
Previous evaluations indicated that our forecasts captured the spatial pattern in rainfed and irrigated corn yields across the U.S. Corn Belt. However, these previous evaluations also indicated that rainfed yields were underestimated at sites with a shallow ground water table during the cropping season, and especially during the critical silking and pollination period, as it was the case of many regions in the central and eastern Corn Belt.
Since the 2019 crop season, we use a new approach to account for the positive impact of groundwater table on corn yield and stability. For a given location, the fraction of fields with shallow groundwater table will be derived from maps on tile drainage, because the latter is a robust indicator of the presence of groundwater table. For fields with presence of shallow groundwater table, we will assume that there is no water limitation. Subsequently, the average forecasted yield for the given location will be estimated as the average of the forecasted yields for fields with and without groundwater table, weighted by their respective shares of corn harvested area at that location.
The following table summarizes the environmental factors that are accounted for by our forecasts:
| Accounted factors | Non-accounted factors |
Solar radiation Temperature Relative humidity Wind speed Reference evapotranspiration Precipitation Soil type Soil water at planting Irrigation Plant population density Hybrid maturity Planting date Shallow groundwater table | Nutrient supply Incidence of biotic stresses (weeds, insect pests, pathogens) Flooding Hail Non-uniform stand Soil crusting Severe heat/drought stress around silking Early killing frost Green snap/lodging |
How Do We Forecast Real-Time Corn Yield Potential?
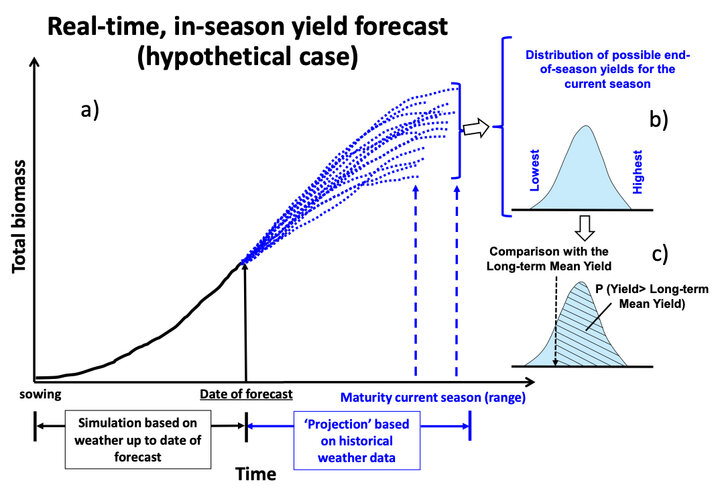
Hybrid-Maize uses measured weather data to simulate crop growth until the forecast date (solid black line in Figure 3a. It will then use historical (20-plus years) weather data to predict all possible weather scenarios for the rest of the season (blue dotted lines in Figure 3a). This results in a range of possible final yields (blue distribution in Figure 3b). By comparing the distribution of forecasted yields (blue-shaded area in Figure 3c) against the average yield simulated for the same location using only the historical weather data (vertical arrow in Figure 3c), it is possible to determine the likelihood (probability) for current season yields to be below, near or above long-term average yield (dashed area in Figure 3c).
Yields reported by the YFC more closely track yields achieved in fields that did not suffer severe yield losses due to pests, hail, water logging, poor establishment or substantially affected by a stress not accounted for in the Hybrid-Maize model.
Finally, it is important to keep in mind that the yield forecast is not field-specific. Instead, it represents an estimate of the average corn yield potential for a given location in absence of the yield reducing factors.
What to Expect During the Growing Season
Early in the season (June), yield forecasts for the current season mainly rely on historical weather and the range of forecasted yields will be wide and almost identical to the range of yields based on the historical weather data alone. As the season progresses (early July to August), and more of the current season’s weather data are used in the simulations, the range of forecast yields will start to converge and may deviate from the long-term average yield (or not) depending upon similarity of the current season’s weather relative to the long-term average weather patterns. As the crop approaches maturity (end of August-September), the range of forecasted yields will further converge, and the final yield can be forecasted with greater confidence.
How to Use These Forecasts to Inform Farm Decisions
When complemented with other sources of information, personal experience and best judgment, the information provided by the YFC allows adjusting yield goals for the current growing season in comparison to normal years, and in some cases this insight can support management decisions such as timing and amounts of fertilization and irrigation, or application of pesticides during the grain filling period. Information from simulations during grain filling provides additional information to guide marketing decisions for all participants in the corn supply chain at regional and national levels (producers, livestock sector, ethanol industry, insurance companies, companies involved in commercialization and transportation, and policymakers).
Four yield forecasts will be released as CropWatch articles during the 2025 crop season, starting from late July. We will also provide information on the range of forecasted potential yields, probabilities for above-, near-, or below-normal yields, and information about crop phenology and the probability of an early killing frost. Forecasts will be discussed in relation to current season’s weather versus the normal weather for each location to identify regions where yields are predicted to be well above, below, or near the long-term average.
