Simulations of 2024 end-of-season corn yield potential and real-time crop stage were performed on July 23 for 43 locations across the U.S. Corn Belt using the UNL Hybrid-Maize crop model in collaboration with faculty and extension educators from 10 universities. This article summarizes the simulated crop stages and yield forecasts; the data can be viewed in Table 1. Details on the UNL Hybrid-Maize crop model and the underpinning methodology to simulate phenology and forecast end-of-season yields, as well as on interpretation and uses of yield forecasts, are described in a previous article.
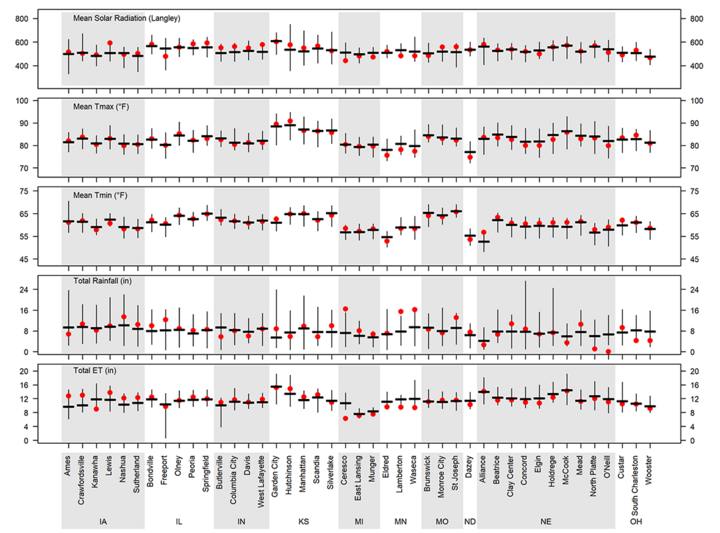
A summary of weather conditions during the last 60 days (from May 23 to July 22) is shown in Figure 1. The season began with near-average temperatures in the central Corn Belt, while daytime temperatures were below normal in the northwestern fringe of the region (ND and MN). Total rainfall was near the historical average at most sites. However, consistent with drought monitor reports, rainfall was below average in western NE and parts of KS and OH, and above average in southern MN, northern IA and eastern NE.
Figure 1. Daily solar radiation, maximum and minimum air temperature (Tmax and Tmin), total rainfall, and total reference grass-based evapotranspiration (ET) for the time period between May 23 and July 22, 2024. Vertical bars indicate the range for these variables based on 20-plus years of weather records. The horizontal thick line indicates the long-term average, and the red dots indicate the 2024 values for the same period.
Table 1. Data from simulations of 2024 end-of-season corn yield potential and real-time crop stage performed on July 23.
Location
Water regime
Long-term average yield (bu/ac) §
Range of Yp forecasts as of Jul 23 (bu/ac)¶ 25th
Range of Yp forecasts as of Jul 23 (bu/ac)¶ 75th
Probability (%) of 2024 yield to be: Below (relative to the long-term Yp)†
Probability (%) of 2024 yield to be: Near (relative to the long-term Yp)†
Probability (%) of 2024 yield to be: Above (relative to the long-term Yp)†
Simulated current crop stage*
NE
Alliance
Irrigated
230
233
268
3%
37%
60%
R2, Blister
Beatrice
Dryland
183
170
205
18%
50%
32%
R3, Milk
Irrigated
241
234
259
15%
50%
35%
R3, Milk
Clay Center
Dryland
186
214
240
0%
7%
93%
R2, Blister
Irrigated
258
241
267
33%
43%
24%
R2, Blister
Concord
Dryland
201
199
260
12%
29%
60%
R2, Blister
Irrigated
268
253
290
29%
33%
38%
R2, Blister
Elgin
Irrigated
268
239
279
47%
36%
17%
R2, Blister
Holdrege
Dryland
143
146
161
0%
69%
31%
R3, Milk
Irrigated
257
234
260
47%
33%
19%
R2, Blister
McCook
Dryland
119
75
114
67%
24%
10%
R3, Milk
Irrigated
238
217
245
45%
36%
19%
R3, Milk
Mead
Dryland
206
226
248
0%
31%
69%
R3, Milk
Irrigated
247
244
264
17%
50%
33%
R3, Milk
North Platte
Dryland
131
75
122
71%
14%
14%
R2, Blister
Irrigated
256
238
291
29%
24%
48%
R2, Blister
O'Neill
Irrigated
247
235
268
26%
36%
38%
R2, Blister
IA
Ames
Dryland
248
210
249
36%
50%
14%
R2, Blister
Crawfordsville
Dryland
238
239
257
3%
79%
18%
R3, Milk
Kanawha
Dryland
256
249
268
0%
88%
12%
R2, Blister
Lewis
Dryland
221
231
265
12%
19%
69%
R2, Blister
Nashua
Dryland
257
254
279
6%
77%
17%
R1, Silking
Sutherland
Dryland
245
244
269
6%
69%
26%
R2, Blister
IL
Bondville
Dryland
252
249
275
0%
81%
19%
R3, Milk
Freeport
Dryland
242
233
261
3%
76%
21%
R2, Blister
Olney
Dryland
210
209
237
9%
53%
38%
R3, Milk
Peoria
Dryland
228
225
255
0%
65%
35%
R3, Milk
Springfield
Dryland
216
196
240
25%
42%
33%
R3, Milk
IN
Butlerville
Dryland
237
216
251
14%
71%
14%
R3, Milk
Columbia City
Dryland
250
258
287
0%
43%
57%
R1, Silking
Davis
Dryland
257
253
266
5%
90%
5%
R2, Blister
West Lafayette
Dryland
254
251
265
5%
76%
19%
R3, Milk
KS
Garden City
Irrigated
237
214
240
53%
42%
5%
R4, Dough
Hutchinson
Dryland
118
81
91
100%
0%
0%
R5, Dent
Manhattan
Dryland
158
175
194
0%
23%
77%
R4, Dough
Scandia
Dryland
158
127
166
50%
39%
11%
R4, Dough
Irrigated
234
221
247
29%
45%
26%
R3, Milk
Silverlake
Dryland
162
175
188
0%
42%
58%
R4, Dough
Irrigated
218
210
229
18%
47%
34%
R4, Dough
MI
Ceresco
Dryland
231
239
266
0%
43%
57%
R1, Silking
East Lansing
Dryland
236
238
264
0%
61%
39%
R1, Silking
Munger
Dryland
245
241
276
0%
58%
42%
R1, Silking
MN
Eldred
Dryland
162
145
179
29%
46%
25%
V10
Lamberton
Dryland
245
254
272
0%
67%
33%
R2, Blister
Waseca
Dryland
246
250
279
2%
57%
41%
R1, Silking
MO
Brunswick
Dryland
194
210
227
0%
33%
67%
R4, Dough
Monroe City
Dryland
191
180
227
17%
30%
52%
R4, Dough
St. Joseph
Dryland
187
216
236
0%
4%
96%
R4, Dough
ND
Dazey
Dryland
164
139
174
41%
41%
17%
V8
OH
Custar
Dryland
231
218
239
15%
74%
10%
R3, Milk
South Charleston
Dryland
235
192
231
53%
44%
3%
R3, Milk
Wooster
Dryland
236
236
264
5%
59%
36%
R1, Silking
§ Long-term (last 20-plus years) potential yield at each location and surrounding area. ¶ Range of forecasted 2024 potential yields based on average planting date in 2024, indicating the potential yields in the 25th and 75th percentile of the potential yield distribution (associated with respective adverse and favorable weather scenarios during the rest of the season). † Probability of obtaining a 2024 yield below (10%) than the long-term potential yield at each location; or 5% at each irrigated location, respectively.
Simulated Corn Stage Across 43 Locations
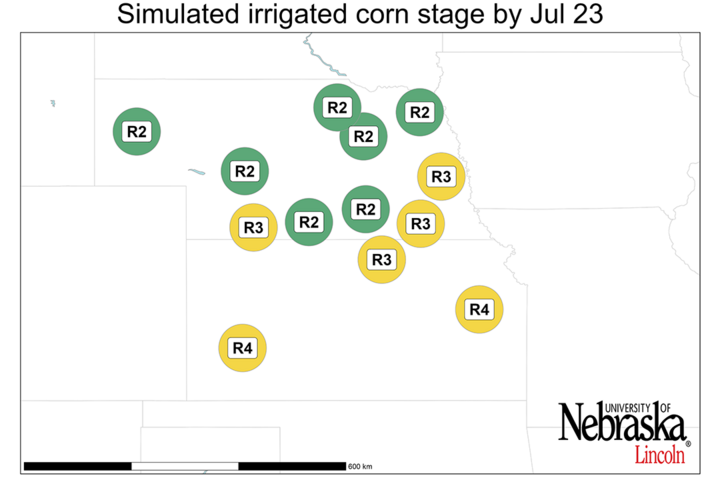
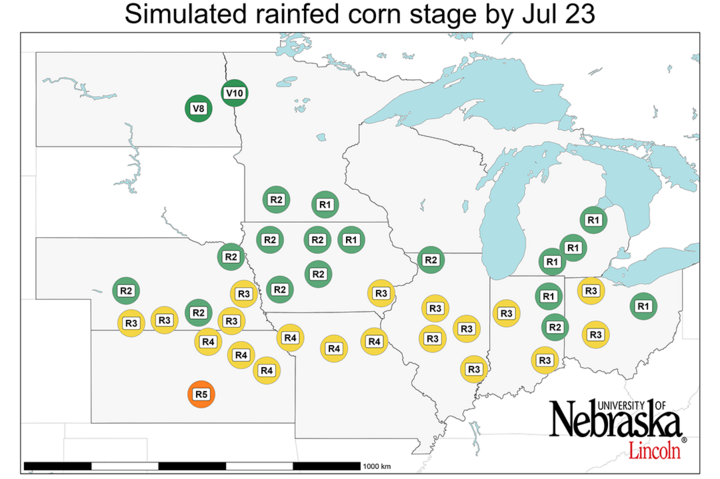
Corn has reached the silking stage at all sites except for the northwestern fringe of the region (ND and northern MN), where it is still in vegetative phases (Figure 2). Additionally, most sites in the southern part of the Corn Belt have reached the milk stage (central and southern IL, southern NE, and western and southern IN and OH) or even the dough stage (KS and MO).
Figure 2a. Simulated developmental stage for irrigated corn at each location. Vn: vegetative stage (nth leaf); R1: silking; R2: blister; R3: milk; R4: dough; R5: dent.
Figure 2b. Simulated developmental stage for rainfed corn at each location. Vn: vegetative stage (nth leaf); R1: silking; R2: blister; R3: milk; R4: dough; R5: dent.
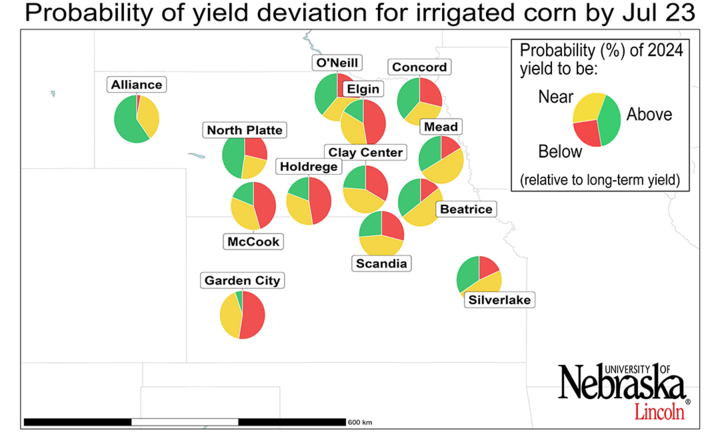
Irrigated Corn: High Probability of Near-average Yields
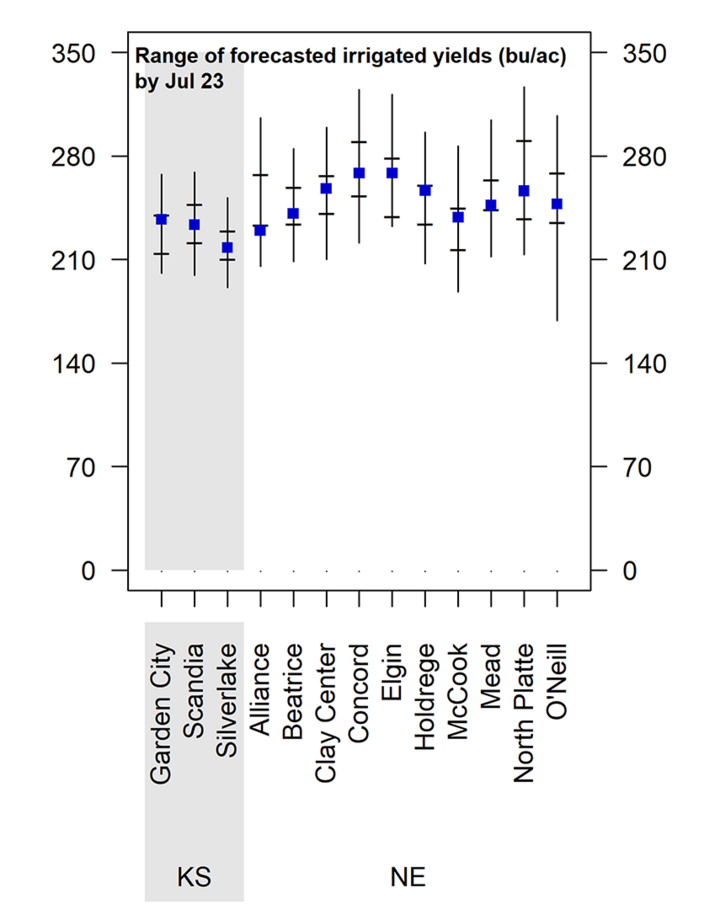
The range of forecasted irrigated corn yield potential for each location, as well as the probabilities for yields above, near, or below average, are shown in Figures 3 and 4. Although it is still early in the season, there is a relatively high probability of near-average yields for most irrigated sites, with above-average yields more likely in western NE. Weather conditions during the grain filling will ultimately determine if most irrigated sites achieve near-average yields.
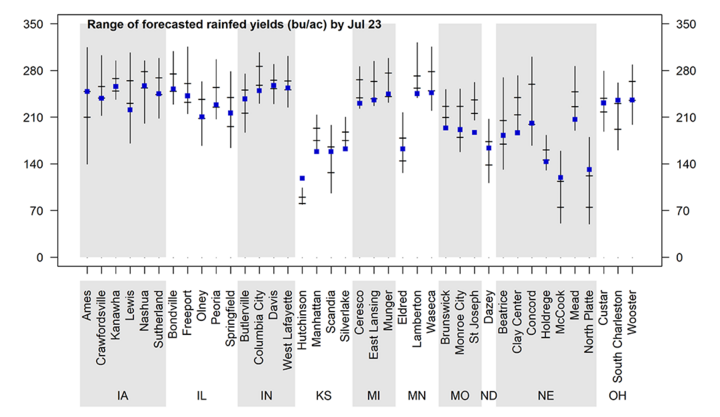
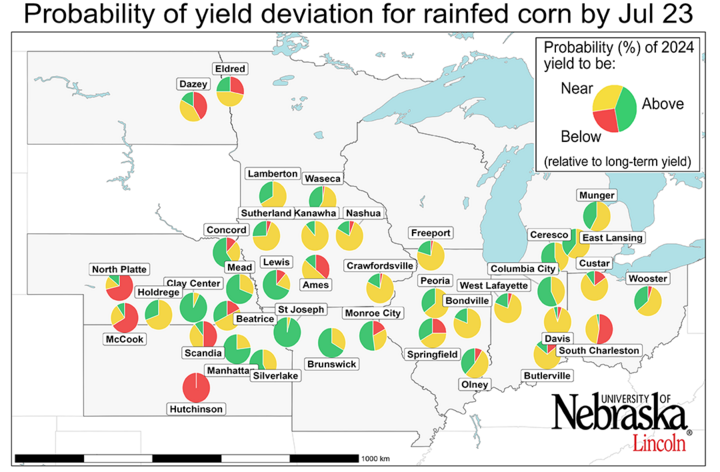
Variation in 2024 Forecasted Rainfed Corn Yield
Forecasted yield potential is variable across rainfed sites (Figures 3 and 4). Overall, at this point of the season, the probability of near-average yields is relatively high in the northern, central, and eastern fringe of the Corn Belt (ND, MN, IA, IL, IN, MI and OH). Indeed, there is a high probability of near-average yields (>75%) in eight sites, which is consistent with USDA NASS crop reports.
Conversely, the probability of above-average yields increases towards the west and southwest of the Corn Belt (southwestern IA, southern and eastern NE, eastern KS, and MO). Finally, the western fringe of the region (western NE and southern KS) exhibits a high probability of below-average yields. Whether these trends persist will depend on precipitation and temperature patterns during the rest of July and early August.
Figure 3a. Vertical lines indicate the range of forecasted 2024 corn yield potential by July 23 based on average planting date in 2024 at each location. Horizontal lines indicate the 25th and 75th percentiles of the yield distribution (associated with respective adverse and favorable weather scenarios during the rest of the season). The blue squares indicate the long-term (2005-2023) average yield potential at each location for irrigated corn.
Figure 3b. Vertical lines indicate the range of forecasted 2024 corn yield potential by July 23 based on average planting date in 2024 at each location. Horizontal lines indicate the 25th and 75th percentiles of the yield distribution (associated with respective adverse and favorable weather scenarios during the rest of the season). The blue squares indicate the long-term (2005-2023) average yield potential at each location for rainfed corn.
Figure 4a. Probability of the 2024 yield potential for irrigated corn to be below (5% for irrigated sites, red color), near (±5% for irrigated sites, yellow color), and above (5% above for irrigated sites, green color) the long-term (2005-2023) average yield potential at each location. The larger a color section is within the pie chart, the higher the probability that end-of-season corn yield will be in that category.
Figure 4b. Probability of the 2024 yield potential for rainfed corn to be below (5% for rainfed sites, red color), near (±5% for rainfed sites, yellow color), and above (5% above for rainfed sites, green color) the long-term (2005-2023) average yield potential at each location. The larger a color section is within the pie chart, the higher the probability that end-of-season corn yield will be in that category.
Conclusions
Corn has reached reproductive stages throughout most of the region. While it is still early to make strong inferences about end-of-season yields for irrigated corn, there is a relatively high probability of near-average yields for most sites, but this could change depending on temperatures during the next weeks.
For rainfed corn, the scenario is diverse across regions, with near-average yields likely in the northern, central and eastern regions of the Corn Belt. However, above-average yields are expected in southern and eastern NE, eastern KS and MO, whereas limited rainfall is leading to below-average yields in western NE and southern KS.
Temperature and rainfall through the end of July and early August will be crucial in determining whether these projections persist.
These forecasts do not take into consideration problems with stand emergence, hail/flooding damage, replanting situations, disease or nitrate leaching. In fields negatively affected by these constraints, actual yields will be lower than estimates provided here.
It is important to keep in mind that yield forecasts are not field specific and, instead, represent an estimate of average yield potential for a given location and surrounding area in absence of the yield-reducing factors mentioned here. Likewise, crop stages and forecasted yields will deviate from the ones reported here in fields with planting dates or hybrid maturities that differ markedly from those used as the basis for the forecasts. We will follow up with further forecasts in early August.