This article summarizes the simulated crop stages and yield forecasts performed on Aug. 27 for 43 locations across the U.S. Corn Belt using the UNL Hybrid-Maize crop model; the data can be seen in Table 1. Details on the underpinning methodology to simulate phenology and forecast end-of-season yields, as well as on interpretation and uses of yield forecasts, are described in a previous article.
Cool weather prevailed over the past three weeks throughout the entire Corn Belt, together with cloudy days in the western fringe of the region. Additionally, 60% of the sites exhibited below-average rainfall, while a few scattered sites in NE, IN and MO received rainfall amounts that exceeded the historical average. A summary of weather conditions during the last three weeks is shown in Figure 1.
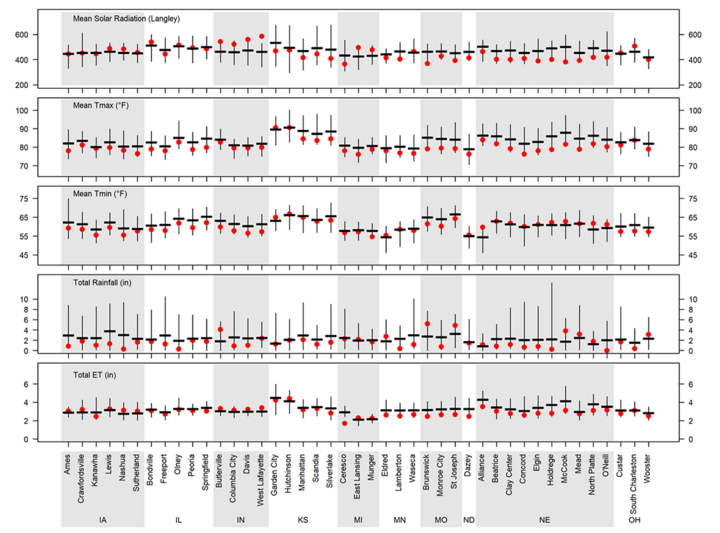
Figure 1. Daily solar radiation, maximum and minimum air temperature (Tmax and Tmin), total rainfall, and total reference grass-based evapotranspiration (ET) for the time period between Aug. 5 and Aug. 26, 2024. Vertical bars indicate the range for these variables based on 20-plus years of weather records. The horizontal thick line indicates the long-term average and the red dots indicate the 2024 values.
Table 1. Data from simulations of 2024 end-of-season corn yield potential and real-time crop stage performed on Aug. 27.
| Location | Water regime | Long-term average yield (bu/ac) § | Range of Yp forecasts as of Aug 27 (bu/ac)¶ 25th | Range of Yp forecasts as of Aug 27 (bu/ac)¶ 75th | Probability (%) of 2024 yield to be: Below (relative to the long-term Yp)† | Probability (%) of 2024 yield to be: Near (relative to the long-term Yp)† | Probability (%) of 2024 yield to be: Above (relative to the long-term Yp)† | Simulated current crop stage* | |
|---|---|---|---|---|---|---|---|---|---|
| NE | Alliance | Irrigated | 230 | 230 | 247 | 0% | 60% | 40% | R5, Dent |
| Beatrice | Dryland | 183 | Black layer on Aug. 22. Final yield: 156 bu/ac | Matured | |||||
| Irrigated | 241 | 242 | 244 | 0% | 100% | 0% | R5, Dent | ||
| Clay Center | Dryland | 186 | 221 | 233 | 0% | 0% | 100% | R5, Dent | |
| Irrigated | 258 | 253 | 26 | 2% | 82% | 15% | R5, Dent | ||
| Concord | Dryland | 201 | 222 | 247 | 0% | 24% | 76% | R5, Dent | |
| Irrigated | 268 | 273 | 293 | 0% | 50% | 50% | R5, Dent | ||
| Elgin | Irrigated | 268 | 255 | 272 | 31% | 53% | 17% | R5, Dent | |
| Holdrege | Dryland | 143 | 156 | 162 | 0% | 33% | 67% | R5, Dent | |
| Irrigated | 257 | 252 | 266 | 8% | 75% | 17% | R5, Dent | ||
| McCook | Dryland | 119 | 107 | 108 | 71% | 29% | 0% | R5, Dent | |
| Irrigated | 238 | 228 | 235 | 19% | 81% | 0% | R5, Dent | ||
| Mead | Dryland | 206 | 239 | 247 | 0% | 0% | 100% | R5, Dent | |
| Irrigated | 247 | 255 | 264 | 0% | 50% | 50% | R5, Dent | ||
| North Platte | Dryland | 131 | 86 | 92 | 100% | 0% | 0% | R5, Dent | |
| Irrigated | 256 | 244 | 272 | 24% | 45% | 31% | R5, Dent | ||
| O'Neill | Irrigated | 247 | 243 | 265 | 13% | 54% | 33% | R5, Dent | |
| IA | Ames | Dryland | 250 | 229 | 244 | 14% | 86% | 0% | R5, Dent |
| Crawfordsville | Dryland | 238 | 249 | 261 | 0% | 76% | 24% | R5, Dent | |
| Kanawha | Dryland | 256 | 249 | 265 | 0% | 96% | 4% | R5, Dent | |
| Lewis | Dryland | 221 | 218 | 228 | 0% | 96% | 4% | R5, Dent | |
| Nashua | Dryland | 257 | 258 | 275 | 0% | 86% | 14% | R4, Dough | |
| Sutherland | Dryland | 245 | 245 | 271 | 0% | 69% | 31% | R5, Dent | |
| IL | Bondville | Dryland | 252 | 264 | 280 | 0% | 66% | 34% | R5, Dent |
| Freeport | Dryland | 242 | 245 | 263 | 0% | 88% | 12% | R5, Dent | |
| Olney | Dryland | 210 | 232 | 236 | 0% | 26% | 74% | R5, Dent | |
| Peoria | Dryland | 228 | 261 | 275 | 0% | 3% | 97% | R5, Dent | |
| Springfield | Dryland | 216 | 261 | 267 | 0% | 0% | 100% | R5, Dent | |
| IN | Butlerville | Dryland | 237 | 249 | 256 | 0% | 90% | 10% | R5, Dent |
| Columbia City | Dryland | 250 | 259 | 283 | 0% | 57% | 43% | R4, Dough | |
| Davis | Dryland | 257 | 262 | 272 | 0% | 95% | 5% | R5, Dent | |
| West Lafayette | Dryland | 254 | 268 | 274 | 0% | 86% | 14% | R5, Dent | |
| KS | Garden City | Irrigated | 237 | Black layer on Aug. 19. Final yield: 225 bu/ac | Matured | ||||
| Hutchinson | Dryland | 118 | Black layer on July 30. Final yield: 82 bu/ac | Matured | |||||
| Manhattan | Dryland | 158 | Black layer on Aug. 13. Final yield: 188 bu/ac | Matured | |||||
| Scandia | Dryland | 158 | Black layer on Aug. 17. Final yield: 104 bu/ac | Matured | |||||
| Irrigated | 234 | 241 | 241 | 0% | 100% | 0% | R6, Black layer | ||
| Silverlake | Dryland | 162 | Black layer on Aug. 13. Final yield: 186 bu/ac | Matured | |||||
| Irrigated | 218 | Black layer on Aug. 17. Final yield: 228 bu/ac | Matured | ||||||
| MI | Ceresco | Dryland | 231 | 239 | 253 | 0% | 74% | 26% | R4, Dough |
| East Lansing | Dryland | 236 | 254 | 274 | 0% | 39% | 61% | R4, Dough | |
| Munger | Dryland | 245 | 257 | 279 | 0% | 53% | 47% | R4, Dough | |
| MN | Eldred | Dryland | 162 | 175 | 201 | 4% | 25% | 71% | R4, Dough |
| Lamberton | Dryland | 245 | 254 | 269 | 0% | 81% | 19% | R5, Dent | |
| Waseca | Dryland | 246 | 264 | 285 | 0% | 43% | 57% | R4, Dough | |
| MO | Brunswick | Dryland | 194 | Black layer on Aug. 22. Final yield: 229 bu/ac | Matured | ||||
| Monroe City | Dryland | 191 | Black layer on Aug. 24. Final yield: 224 bu/ac | Matured | |||||
| St. Joseph | Dryland | 187 | Black layer on Aug. 21. Final yield: 236 bu/ac | Matured | |||||
| ND | Dazey | Dryland | 164 | 139 | 172 | 28% | 62% | 10% | R4, Dough |
| OH | Custar | Dryland | 231 | 223 | 233 | 0% | 100% | 0% | R5, Dent |
| South Charleston | Dryland | 235 | 205 | 214 | 62% | 38% | 0% | R5, Dent | |
| Wooster | Dryland | 236 | 255 | 275 | 0% | 38% | 62% | R4, Dough | |
§ Long-term (last 20-plus years) potential yield at each location and surrounding area.
¶ Range of forecasted 2024 potential yields based on average planting date in 2024, indicating the potential yields in the 25th and 75th percentile of the potential yield distribution (associated with respective adverse and favorable weather scenarios during the rest of the season).
† Probability of obtaining a 2024 yield below (10%) than the long-term potential yield at each location; or 5% at each irrigated location, respectively.
Simulated Corn Stage Across 43 Locations
Corn has reached maturity in the southern fringe of the Corn Belt (KS and MO). In the rest of the region, corn has reached dent stage, except for a few sites in the northern and eastern region where corn is still in dough stage. In general, corn development is ahead relative to the 2023 crop season, except for ND, MN and IA, where development is similar to last year (Figure 2).
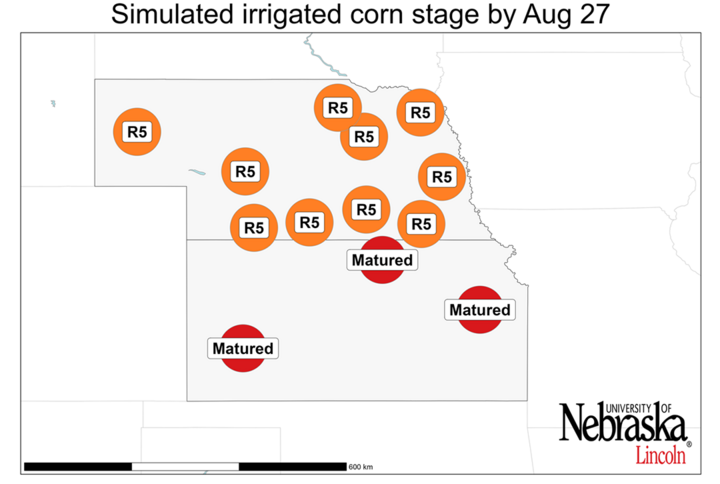
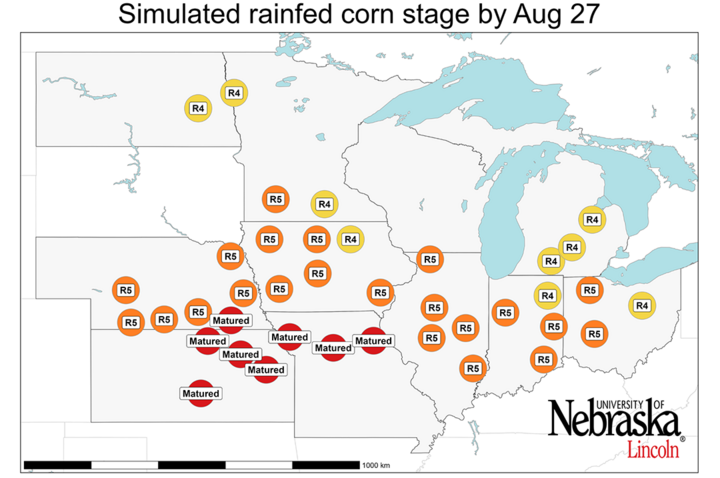
Figure 2. Simulated developmental stage for irrigated and rainfed corn at each location. R4: dough; R5: dent; physiological maturity: Matured. Separate maps are shown for irrigated corn (top) and rainfed corn (bottom).
Irrigated Corn: Near Average Yields Are Expected
The forecasted range of irrigated corn yield potential for each location, along with the probabilities for yields above, near, or below average, are shown in Figures 3 and 4. Half of the sites show a high probability (>75%, that is, three out of four chances) of near-average yield potential. This is also likely for the rest of the sites, except for one site in southwestern KS, where below-average yield are expected, and in eastern NE, where there is still a relatively high probability of above-average yield. At this point, the forecasted scenario for irrigated maize in the current season appears to be similar to that of 2023.
Rainfed Corn: Near-to-above Average Yields Across Rainfed Sites
Although forecasted yield potential is variable across the 39 rainfed sites (Figures 3 and 4), there is a high probability of near to above-average yields for most sites. Overall, 11 sites across NE, KS, MO and IL show a high probability (>75%) of above-average yields, and there is a high probability of near average yields in 12 sites distributed in the central and eastern regions (IA, southern MN, northern IL, IN, OH and MI). Conversely, below-average yields are only likely in western NE and KS.
When compared with the 2023 season results, the current season's scenario is more optimistic in ND, MN, IA, IL and MO. Conversely, the forecasts are more pessimistic in OH compared with last season, while KS, NE and IN are expected to have fairly similar yields overall.
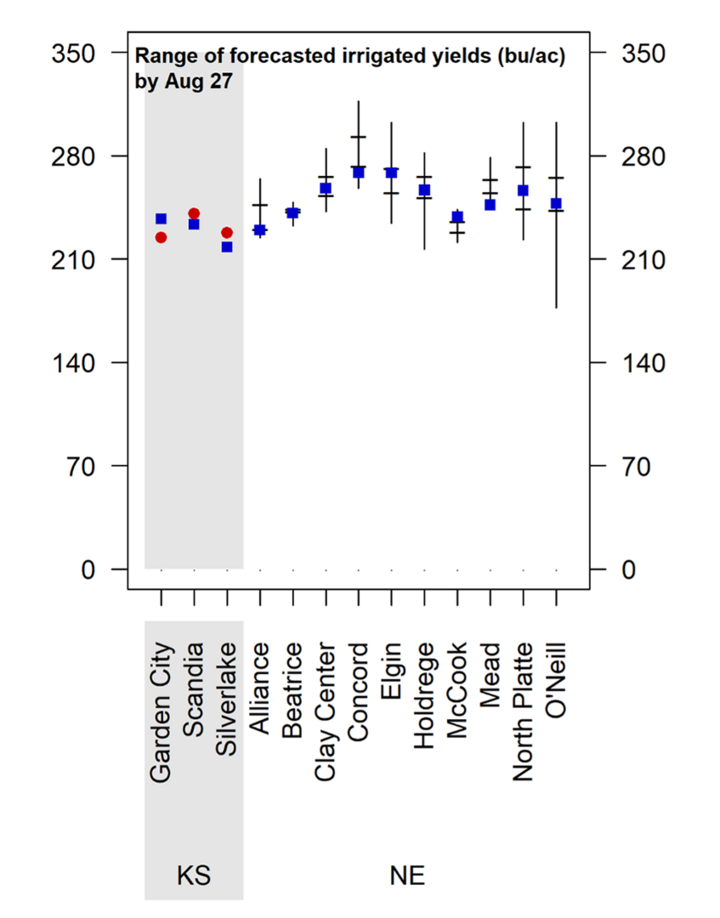
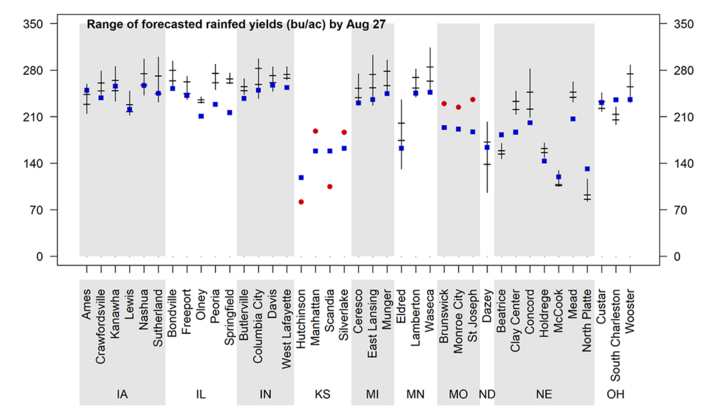
Figure 3. Vertical lines indicate the range of forecasted 2024 corn yield potential by Aug. 27 based on average 2024 planting date at each location. Horizontal lines indicate the 25th and 75th percentiles of the yield distribution (associated with respective adverse and favorable weather scenarios during the rest of the season). The blue squares indicate the long-term (2005-2023) average yield potential at each location and the red dots represent the forecasted 2024 corn yield potential at sites that have already reached maturity. Separate charts are shown for irrigated corn (top) and rainfed corn (bottom).
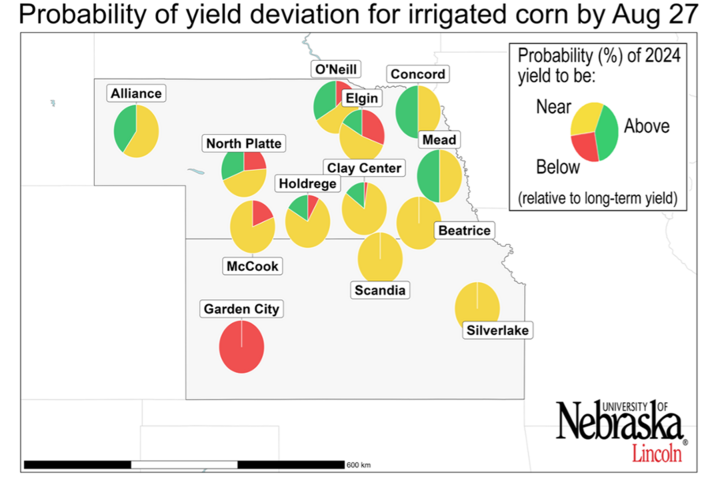
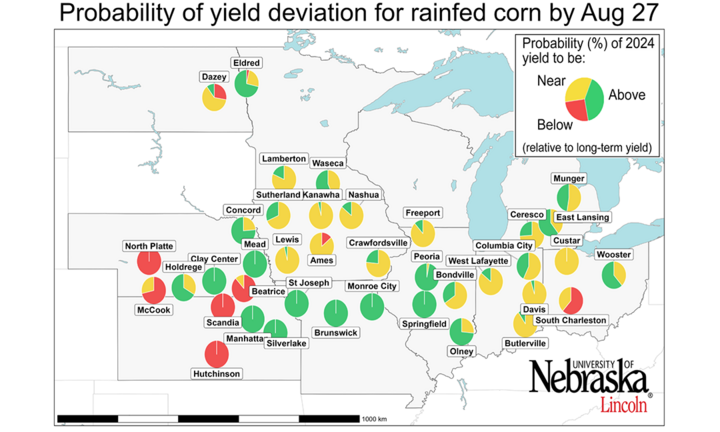
Figure 4. Probability of the 2024 yield potential to be below (at least 10% below for rainfed sites or 5% for irrigated sites, red color), near (±10% for rainfed sites or ±5% for irrigated sites, yellow color), and above (at least 10% above for rainfed sites or 5% above for irrigated sites, green color) the long-term (2005-2023) average yield potential at each location. Separate maps are shown for irrigated corn (top) and rainfed corn (bottom). The larger a color section is within the pie chart, the higher the probability that end-of-season corn yield will be in that category.
Conclusions
Corn has already reached the dough stage across the Corn Belt, while dent stage (or even black-layer) has been attained in the southern fringe of the region. Similar results are expected compared to our previous forecasts: there is a high probability of near-average yields in irrigated sites. For rainfed corn, yields are expected to be near or above-average, except for a few sites in western NE and KS, where there is a high probability of below-average yields.
Overall, regional average yield this season is expected to be above the historical yield trend (+6% yield deviation), which is consistent with USDA-NASS prediction of above-average yields.
These forecasts do not take into consideration problems with stand emergence, hail/flooding damage, replanting situations, disease or nitrate leaching. In fields negatively affected by these constraints, actual yields will be lower than estimates provided here.
It is important to keep in mind that yield forecasts are not field specific and, instead, represent an estimate of average on-farm yield for a given location and surrounding area in absence of the yield-reducing factors mentioned here. Likewise, crop stages and forecasted yields will deviate from those reported here in fields with planting dates or hybrid maturities that differ markedly from those used as the basis for these forecasts.
We will follow up with the final forecasted yield and analysis of the 2024 crop season in September.
