
The potential use of a forensic analysis to identify the timing of suspected dicamba exposure was discussed in a previous CropWatch article. In this article, we show how to apply this forensic analysis, using an actual field case of dicamba-injured soybean plants observed in a plot at the Eastern Nebraska Research and Extension Center (ENREC) near Mead. A related article looks at whether dicamba injury changes the node accrual rate in soybean.
Case Study Timeline
May 10, 2018 (Cover Crop Termination): A cereal rye cover crop had been planted on the west half of this plot in fall 2017, with the cover crop terminated on May 10. The dead cereal rye stems remained upright for several weeks after the May 23 soybean planting date before falling down.
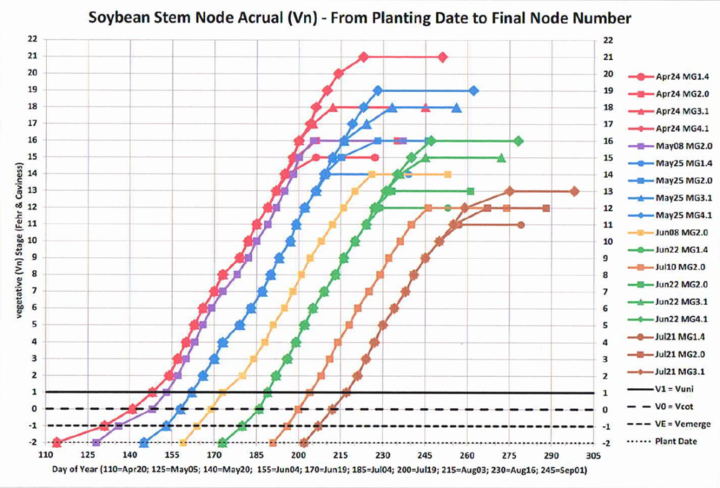
May 23, 2018 (Plot Planted): The ENREC plot consisted of eight rows of a dicamba-resistant variety and eight rows of a dicamba-sensitive variety planted in a west-east direction into 30-inch rows that were 50 feet long. (Both were the same MG 2.4.) The varieties were not distinguishable from each other during vegetative development (i.e., both had identical calendar dates for Vn stages of VE (emergence), VC (V0) (cotyledon stage), V1 (unifoliolate stage), V2 (1st trifoliolate stage), etc. (Fehr and Caviness, 1980) and, as expected, identical node accrual rates from V1 onward (Figure 1).
June 26 (Injury Observed): The pinched drawstring injury typical of dicamba was observed in the dicamba-sensitive variety plant leaflets (Figure 2), but NOT in the dicamba-resistant variety. On June 26 both varieties were determined to be at stage V7-R1. Note: No dicamba-containing herbicide had been applied to this plot (or to any other of the 35 plots at ENREC), nor was any such herbicide used in 2018 in the ENREC sprayer tank.
July 5 (Plant Examination): It had become clear that the dicamba-sensitive variety plants (eight rows on the south side of the ENREC plot) were exhibiting observably significant leaflet tip injury (Figure 3a), though that injury was observably less in the west half (i.e., eight rows there were located in the cereal rye cover crop area (Figure 3b).
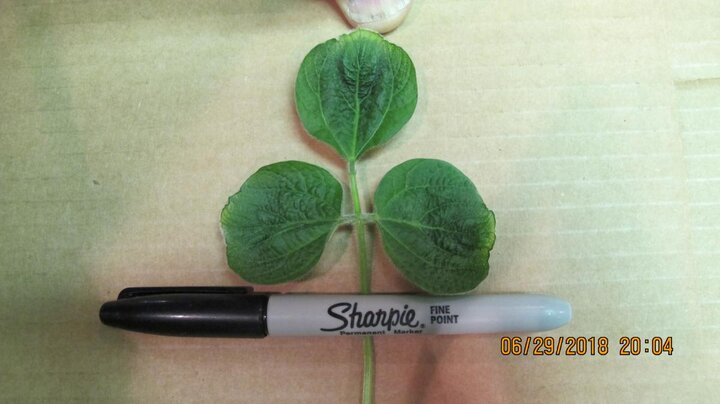
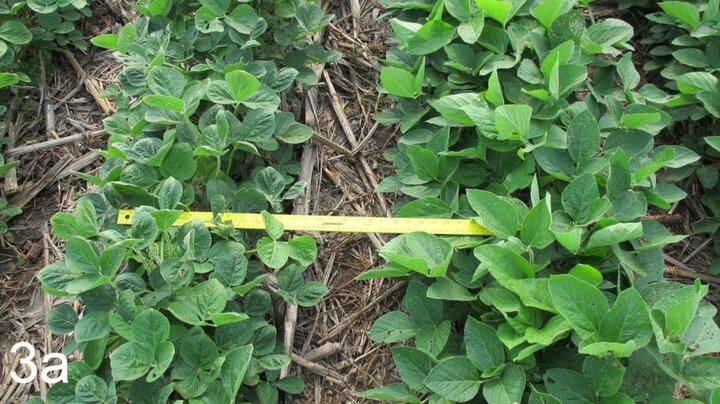
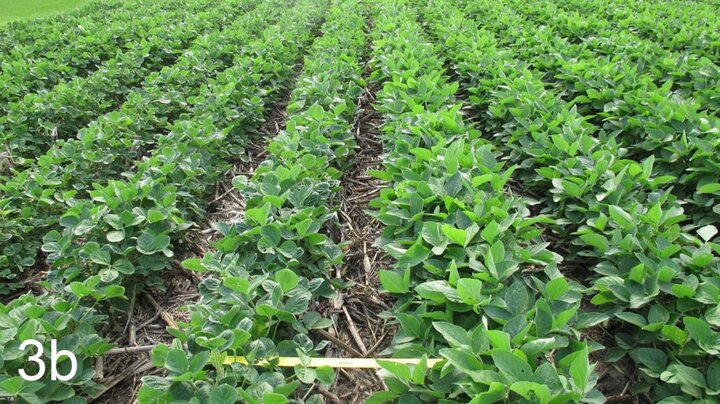
Figure 3a. A July 5, 2018 photo of side-by-side rows of a dicamba-sensitive variety (left) and a dicamba-resistant variety (right). Both varieties are MG 2.4, were planted on May 23, and were at the same soybean vegetative stage of V9 and reproductive stage of R2 on July 5.
Figure 3b. The same field as Figure 3a, with eight rows of a dicamba-sensitive variety on the left and eight rows of a dicamba-resistant variety on the right. The left eight rows had been fall-planted with a cereal rye cover crop that was terminated on May 10. The dead cereal rye stems remained upright for several weeks after planting.
This July 5 observation suggested that:
- Off-target movement of fine spray droplets (or possibly volatilized dicamba vapor) had originated from a dicamba-containing herbicide applied to a field located outside of the ENREC area.
- The standing dead cereal rye stems towering over soybean seedlings/plants may have provided some subtle protection from that off-target movement. We shall not discuss the significance of latter observation here, but it will likely be of interest to weed science researchers interested in cover crop-soybean herbicide interactions.
Please take the
Nebraska Soybean Production and Dicamba Use Survey.
Find information on the survey and how the results will be used here.
Dicamba-induced leaflet tip injury can significantly reduce the length of an affected leaflet (Figure 2), thus negatively impacting the soybean crop’s capacity to capture incoming solar energy for use in photosynthesis. On July 5, examination of the adjacent plant rows of injured dicamba-sensitive (Figure 3a) and non-injured dicamba-resistant varieties (Figure 3b) showed that the eight rows of the sensitive variety had visibly less overall leaf area at multiple stem nodes, and also had fallen behind the eight rows of the resistant variety relative to normal seasonal progress to full canopy closure. Clearly, the leaf-injured dicamba-sensitive variety was precluded from collecting as much daily solar energy as its counterpart.
Forensic Analysis – Plant Data
July 18 (Node Counting): To determine when the ENREC plot might have been exposed to dicamba, the forensic analysis described in a prior CropWatch article was applied to this field as a test case. On July 18, 10 random plants were collected from each variety to assess their vegetative (Vn) and reproductive (Rn) stages; both varieties were found to be at the same V13 R4 stage. The 10 plants of the injured dicamba-sensitive variety were then placed on a pickup truck tailgate and their main stem nodes were ink-marked upward with a zero (0) at the cotyledon node scar, 1 at the unifoliolate leaflet node scar, and at nodes 2, 3, 4, and on up to stem node 13. The lowest node at which the trifoliolate leaflets were exhibiting a "pinched drawstring" leaflet tip was determined to be main stem node 3 in all 10 plants. It was windy that day, so a yellow ruler was laid on top of those 10 plants so that the node 3 ink mark was showing on each plant just above the ruler (Figure 4a). Small wood stakes were added to point to the node 3 terminal leaflet tips that exhibited the "pinched drawstring" injury. Lateral leaflet tips of the node 3 trifoliolate leaf were also exhibiting the leaflet injury, but could not be held down in the wind to be seen in this photo.
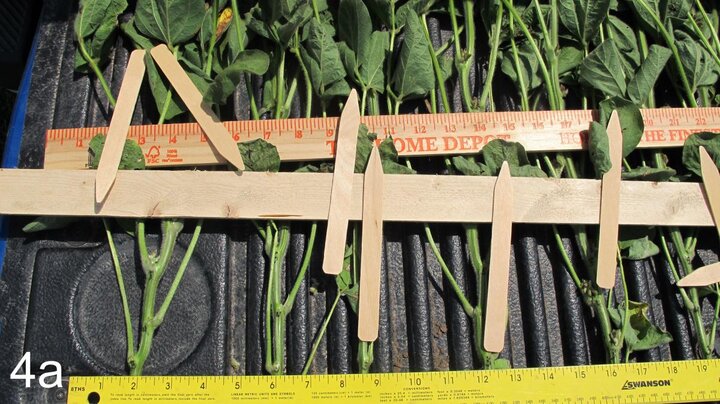
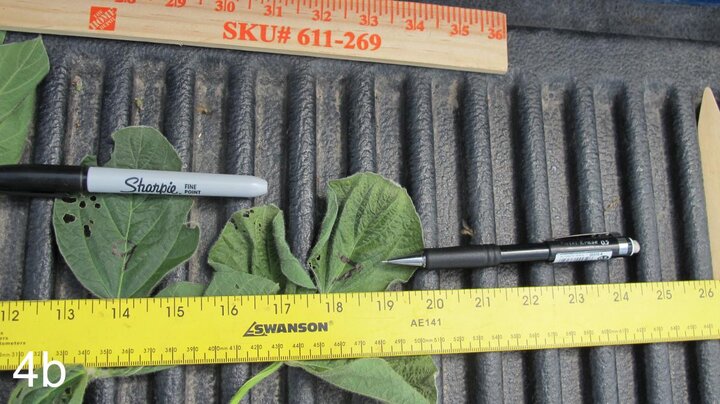
Figure 4a. Plants collected on July 18 from the dicamba-sensitive variety. A yellow ruler was use to hold down the plant stem bottoms (on this windy day), but with the (ink-numbered) stem node 3 kept visible just above ruler top edge. Another ruler was used to hold down the plant tops, with the wooden stick used to hold down the node 3 trifoliolate leaf, so that the pinched draw-string injury on the node 3 terminal leaflet could be viewed (via the small plot stakes pointing to those terminal leaflets). The lateral leaflets were injured but are not viewable here. Only six of the 10 plants are visible in this photo, but the other four were similarly injured.
Figure 4b. In all 10 plants, the uppermost node exhibiting pinched drawstring leaflet injury was node 9. The terminal leaflet “centers” are ink-marked 7 (left) and 9 (right) to reflect their stem nodes. The node 10 terminal leaflet is located at the far left in this photo and it showed no leaflet tip injury.
The next forensic step was to identify all higher stem nodes with leaflets exhibiting a pinched draw-string injury. Injured leaflets were found at nodes 4, 5, 6, 7, 8, and 9, but not at nodes 10 to 13, in all 10 plants (Figure 4a). The leaflets at nodes 7, 8, and 9 (Figure 4b) were likely in a leaf primordia stage when the (then) emerged leaflets at 4, 5, and 6 were presumed to have been directly exposed to dicamba. Leaflets at nodes 7, 8, and 9 were still injured due to the translocation of dicamba from the exposed leaves to the not-yet-emerged leaf primordia developing at the stem tip. The degree to which dicamba is translocated continuously to the stem tip is dose-dependent, determining how many successive leaf primordia at the main stem tip are affected in a given dicamba exposure event.
Given the foregoing observations, one can infer:
- The main stem node 3 leaf was injured because it had not fully completed its development when dicamba exposure occurred.
- Of the 13 main stem nodes that subsequently appeared, node 9 leaf was the uppermost one exhibiting dicamba injury (via translocation). Six cycles (9 - 3) of 3.7 days (per each new node) would be expected to occur between stages V3 and V9, totaling 22.2 days (6 x 3.7).
- In addition, four cycles of 3.7 days would have occurred between V9 and V13 (July 18), totaling 14.8 days (4 x 3.7) . The sum of 22.2 and 14.8 days is 37 days, which presumptively elapsed from the calendar date of V3 to the calendar date (July 18) of V13. Thus, the dicamba exposure event likely occurred at the V3 stage, which was estimated to have been on or about June 11 (37 days before July 18).
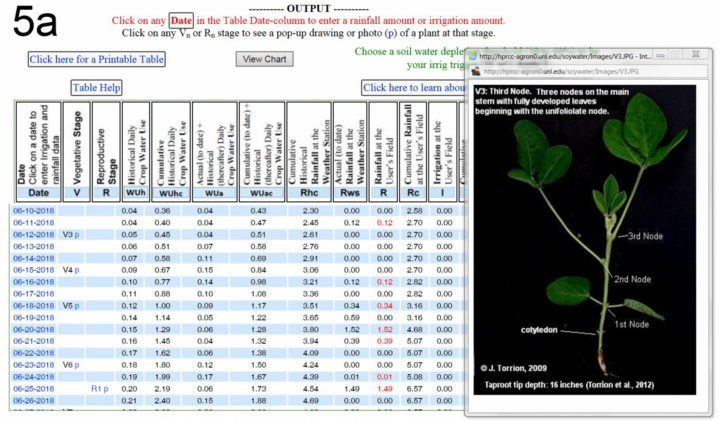
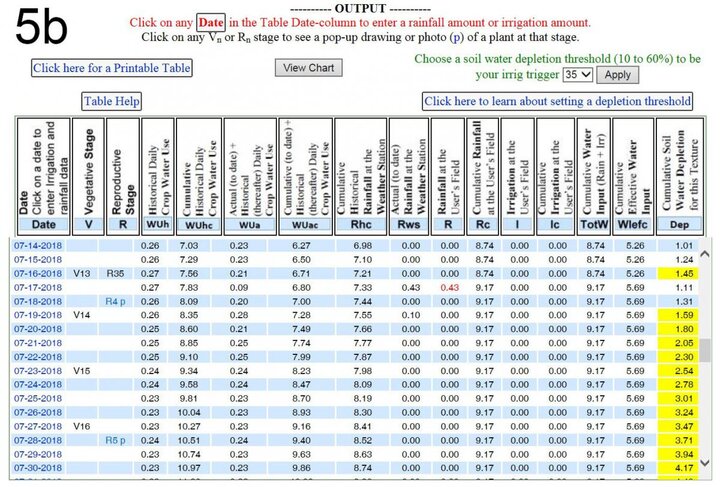
Figure 5a. SoyWater projected calendar dates for the Vn and Rn stages for the ENREC plot planted with the two MG 2.4 varieties on May 23. This screen shot captures the portion of the SoyWater table showing a June 12 projection of V3 attainment for both varieties. The V3 pop-up photo is generated by a mouse click on the V3 p text in the left side of the table.
Figure 5b. This screen shot captures the portion of the SoyWater table showing a July 18 projection of V12 R4 for both varieties.
The UNL SoyWater website, which is used for irrigation scheduling in a given soybean field, also can be useful in a forensic analysis because it projects the calendar dates of the Vn and Rn soybean crop stages via the SoySim crop model embedded in SoyWater, when the planting date and variety MG are known. For this particular ENREC plot, the SoyWater calendar date projections for V3 and V13 were June 12 and July 17, respectively (Figure 5), which were about the same as the calendar dates ascertained for the in-field manual plant sampling method discussed above.
Because the suspected date (June 11 or 12) of this dicamba exposure was very early in the 2018 planting season, the dicamba off-target movement likely did not originate from a dicamba-containing herbicide applied to a dicamba-resistant soybean in a field near the ENREC plot. A more likely inference is that the off-target movement originated from a dicamba-containing herbicide applied to a nearby corn field. Such off-target movement from corn to soy is not uncommon.
Forensic Analysis ― Weather Data
To assess prevailing hourly wind direction and speed at this plot for a seven-day period beginning just after midnight on June 11 and ending just before midnight on June 17, hourly weather data was obtained from the High Plains Regional Climate Center automated weather station one mile north of the ENREC plot (A255369 ITHACA 3E). An examination of the seven-day graphs of this hourly data (Figure 6) reveals that:
- These seven days in June were mostly sunny (except briefly around noon on June 12 and 18).
- The air temperature maximum was 90-95°F on most days, but rose to only 85°F on June 12 and 13.
- The relative humidity (RH) values were 95% in the mornings of June 12 and 13, but then quickly declined to afternoon values of a respective 60% and 40% (Post-noon RH values also were 40% on June 15 and 16.)
- Wind speeds were below 10 miles/hour for the entire day on June 11-12.
- The wind direction was consistently uni-directional from the south or southeast on most days/nights, except for one time: from mid-afternoon on June 11 to mid-morning of June 13 (Figure 6 bottom right). The wind shifted from the south to the northeast between 2 p.m. and 6 p.m. on June 11, though the overnight light winds came from the west-southwest. In contrast, from 2 p.m. to 6 p.m. on the afternoon of June 12, the wind was from the northeast.
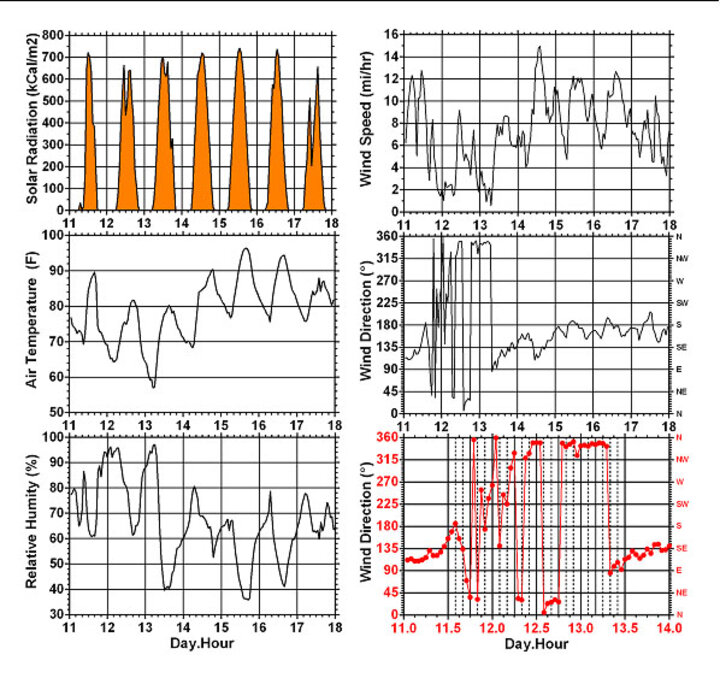
The ENREC site is bordered on the south by large acreage of rangeland, on the west and north by tall tree windbreaks, and on the east by a center-pivot field of corn. It is now known that this corn field was sprayed with the corn herbicide Status (5 oz/acre) with AMS (2.57 lb/acre) on June 12. Based on a sprayer operator record, spraying started at 1:47 pm (with wind speed / direction recorded as 6 mph out of north-northwest) and ended at 3:47 pm (with a 3.5 mph wind out of the north). In contrast, as noted above, the wind was from the northeast from 2 to 6 p.m. at the weather station.
By using this forensic analysis method, one could infer that the June 12 corn spraying event was likely the source of the dicamba (present in Status) that moved from the corn field to the ENREC soybean plot, thus presumptively resulting in the classic dicamba-induced soybean leaflet injury shown in Figures 2 and 3.
This example of a forensic analysis applied to an actual case of soybean dicamba injury will likely be of interest to crop consultants, agronomists, farmers, and Department of Agriculture personnel.
References
Fehr, Walter R. and Charles E. Caviness. 1980. Stages of soybean development. ISU Special Report 87. http://lib.dr.iastate.edu/specialreports/87
Gaspar, Adam, John Gaska, Mimi Broeske, and Shawn Conley. A Visual Guide to Soybean Growth Stages. University of Wisconsin-Madison.
UNL SoyWater website. http://hprcc-agron0.unl.edu/soywater/
Rees, Jenny, James Specht, Randy Pryor, Todd Whitney, Amit Jhala, Robert Klein, and Stevan Knezevic. Potential Off-Target Dicamba Movement from Corn Applications, Nebraska Extension CropWatch.unl.edu, Feb. 15, 2018.
High Plains Regional Climate Center website. https://hprcc.unl.edu/awdn.php
