Authors’ note: Soybean leaves may exhibit damage from a number of factors, including various herbicide chemistries, viruses, and environmental impacts. It’s important to look at all potential factors before assuming it was due to dicamba. These resources may be helpful: Dicamba injury to soybeans, from the University of Wisconsin, and Understanding Growth Regulator Damage to Soybean in this week’s CropWatch.

Injury from High-Dose vs. Low-Dose Exposure
An unintended exposure of soybeans to dicamba will lead to leaflet injury symptoms whose severity will be proportional to the dosage.
With high-dose dicamba exposure, the entire plant (stems, leaves, and petioles) will be severely deformed, which will make a forensic analysis very difficult. However, high-dose dicamba injury is typically discernible much sooner after the dicamba exposure event.
Low-dose exposure, however, often is not detected for two weeks because the leaflet tip draw-string injury is subtle and not particularly visible when driving by a field. Bi-weekly field scouting will help you recognize off-target low-dose dicamba injury earlier after the exposure event date.

Correctly Finding Node Numbers
At this point in the growing season, you may find the absence of lower leaves within the canopy. Correctly identify nodes by looking for these features:
- Every node will leave a “scar” where the original leaves were attached. Sometimes new branches/buds occur from these areas. Sometimes you can feel a raised area on the stem indicating the presence of a node.
- Both the cotyledon and unifoliolate nodes have double scars on the sides of the stem. The cotyledon double scar will be found lowest on the stem with the unifoliolate scar being above it at a 90 degree rotation on the stem.
- Every trifoliolate leaf will have a single scar and will alternate sides up the stem.
If your answer to this title question is “Yes,” you may want to determine when, after planting or emergence, the plants in your field were actually exposed to dicamba. Dicamba-induced leaf injury is not immediately detectable after the plant is exposed to spray droplets or vapor because dicamba only affects leaflet regions that are still undergoing cell division, and fully developed leaflets will thus not be impacted. You may not become aware of dicamba-induced leaf injury for a week or two after the day on which the plants were exposed to dicamba.
In this article we will explain how you can use a forensic strategy to determine the approximate calendar date when the plants in your field were likely exposed to dicamba, either directly from sprayer tank contamination, or indirectly as a result of physical drift that arises from the movement of fine-sized spray droplets suspended in the air, or vapor drift that arises from volatilization of the dicamba present on leaf or soil surfaces followed by subsequent movement of that vapor. Research has shown dicamba can still be present in the air 72 hours after application, but the concentration of dicamba in the air to cause visible injury lasts for the first 36 hours, according to recent research. Off-target dicamba herbicide movement to soybean can originate from dicamba-based herbicides applied to corn fields, pastures/range, nearby fields of dicamba-resistant soybean varieties, road-side ditches, and along railroad tracks.
Soybean Sensitivity
Soybeans are inherently very sensitive to dicamba. Damage is visible at even 1/20,000 of the 1x use rate. Based on a use rate of 1/2 lb active ingredient per acre and a 4-lb acid equivalent per gallon, a single drop of the product can cause visible injury to 2.7 acres.
Engenia® has a 5-lb acid equivalent per gallon so one drop of it could cause visible injury to 3.4 acres.
Xtendimax® and FeXapan® have a 2.9-lb acid equivalent per gallon so one drop of these herbicides could cause visible injury to 2 acres. Corn herbicides such as Status®, DiFlexx® and DiFlexx DUO® contain 4 lb of acid equivalent per gallon which could cause visible injury to 2.7 acres.
Forensic Strategy
How might you determine the likely calendar date or developmental stage when your soybean plants were exposed to dicamba droplets or vapor?
You can use a forensic strategy that relies on this fact: Low-dose dicamba injury (i.e., leaflet-cupping symptoms) will become subsequently apparent in those leaflets that were still undergoing cell division at the leaflet margins at the time they were exposed to dicamba droplets or vapor. Because fully developed leaflets were no longer undergoing cell division on the day of dicamba exposure, they will not show any observable dicamba injury. This differential state of cell division (i.e., completed or not) between successively developed leaflet nodes has forensic value in terms of identifying when, during the soybean development time frame, the dicamba exposure likely occurred, or inversely, for exclusionary purposes, when the exposure could not have occurred.
So how do you use this information in a forensic manner?
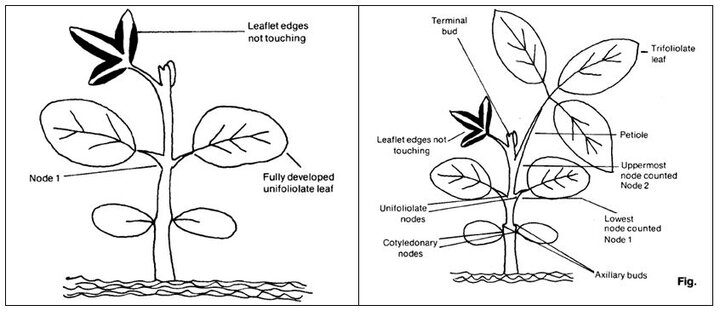
Vegetative development in soybean is routinely characterized using the Fehr and Caviness (1977) staging system. The (first) bottom main stem node where the cotyledons appear is counted as node number zero (0), the (next) node at which the unifoliolate leaflets appear is counted as node one (1), and then all subsequent main stem nodes at which trifoliolate leaflets appear are assigned successive main stem node numbers of 2 on up to n as shown in Figure 1.
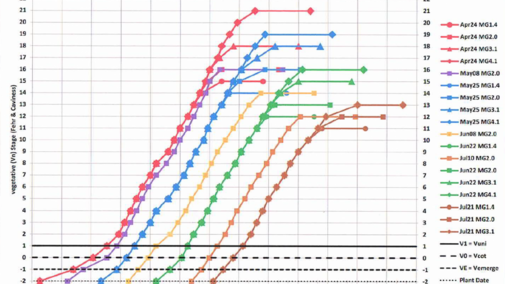
After soybean vegetative stage V1 a new trifoliolate-bearing main stem node appears on the soybean main stem every 3.7 days (Bastidas et. al, 2008) and this continues until the plants attain reproductive stage R5 (beginning of seed-fill). This is the case for MG 1.0 to MG 4.0 varieties planted early (late-April) or late (late-June) in Nebraska on either irrigated or rainfed fields. The 2017 main stem node accrual data collected at the Eastern Nebraska Research and Extension Center near Mead clearly documents this 3.7-day linear trend (Figure 2).
Knowing this node accrual rate, you can go to a low-dose dicamba-injured field and randomly select 10 representative plants. Count the number of main stem nodes present on those plants, starting with the cotyledon node (= 0) and on upward (unifoliolate node = 1) until you reach a node near the stem tip that has a fully expanded trifoliolate leaflet. Fehr and Caviness (1977) defined a leaflet as attaining a fully expanded leaflet status at a given node when the trifoliolate leaflets at the next (above) node had just unfolded (for example, see the fully expanded leaflet node number for stages V1 and V2 shown in Figure 3). Note that in Figure 1, the (Fehr and Caviness-defined) fully expanded leaflet is at main stem node number 10.
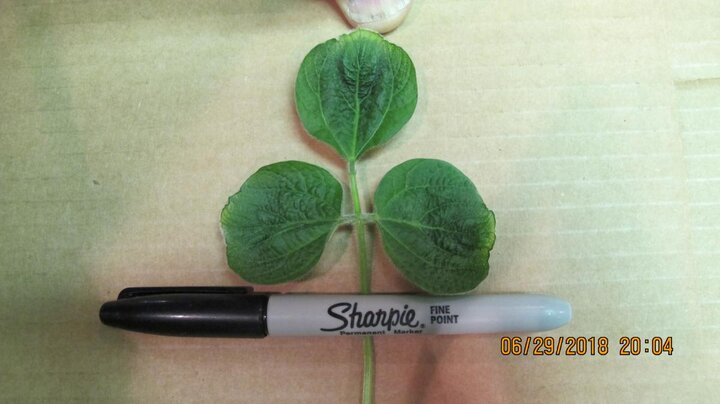
Now in your 10-plant sample from a field showing dicamba leaflet injury, locate the lowest main stem node at which you can see a trifoliolate leaf whose three leaflets exhibit a “pinched” drawstring tip shape (Figure 4). (Note: In some parts of the state, we have seen this injury occur as early as the unifoliolate leaves. Also be aware of branching that occurs as the season progresses. New branches from lower stem nodes may have trifoliolates exhibiting injury symptoms, given dicamba can be translocated, but only the original branches with trifoliolates should be considered for accurate timing using this forensic strategy.) Make note of that main stem node number. As previously noted, the leaflet at the main stem node was likely just short of full development on the day that dicamba exposure occurred.
Now, move up the plant stem and note each successive main stem node where leaflets are exhibiting various degrees of dicamba-induced leaflet-cupping. The number of impacted nodes will depend on the dicamba dose level (few nodes with a light dose, many with a higher dose). You will need to stop your node count at the uppermost stem node that has a fully developed leaflet (as noted in the prior paragraph). Although you may see cupping in young (not yet fully developed) leaflets still emerging at the stem tip, do not count or include those node numbers. Why not? Because as noted earlier, the 3.7-day interval between successive nodal leaflet production on the main stem starts with a fully developed leaflet node n and ends with a fully developed leaflet node n+1 (for example, V1 to V2 in Figure 3). These newly emerging, dicamba-injured, very young leaflets are just reflecting the fact that dicamba imposed on a given leaflet was translocated to many very young nodal leaflets developing at the stem tip.
Field Example
Now, as an example of applying a forensic strategy to the title question, assume that you observed “pinched tip injury” (Figure 4) on leaflets located at main stem node 5 (but not in any below leaflet nodes). Also assume that you observed cupped leaflets at each successively higher node on up to the final topmost node you can count, which by definition must have a “fully developed leaflet” (Figure 1). Assume that this was main stem node 9. So, given the fact that a new node accrued on the soybean main stem every 3.7 days (Figure 2), subtracting 5 from 9 indicates that four node-accrual cycles occurred. You can now forensically estimate that the dicamba exposure likely occurred about 15 days prior to today (4 x 3.7 = 14.8). (Remembering, of course, that “today” was when you observed a fully developed injured leaflet at main stem node 9.) The leaflets at main stem node 4 had just completed cell division at their tips 15 days ago. Thus you can presumptively conclude, using this forensic strategy, that the dicamba exposure occurred during development of the node 5 leaflets.
You may, of course, be interested in alternatively estimating the calendar date on which dicamba exposure presumably occurred during the growing season. Forensically, this will require translating the Vn stage in crop-development time to a calendar date when that stage occurred. This translation is possible using a soybean crop model like SoySim, which is embedded in the UNL SoyWater program. (SoyWater would be easier for a Nebraska soybean producer or agronomist to use for a forensic analysis.) Because the 3.7-day node-to-node accrual interval commences ONLY after the soybean crop attains stage V1 (Figure 3), and because the calendar date of V1 varies according to planting date (Figure 2), inputting the planting date and variety maturity group for the dicamba-injured soybean field into SoyWater will create a SoyWater field crop development table that projects the calendar dates for each and all Vn stages. Going back to the above example, you concluded that leaflets at main stem node 5 were impacted by dicamba before those leaflets had completed cell division at their tips. So, you now just examine your SoyWater field table to identify the calendar date projected for the attainment of stage V5. You can now forensically conjecture that the dicamba exposure must have occurred on or near that V5 calendar date.
Details on how to use SoyWater to project/track soybean Vn and Rn stages for decision-making purposes are available on-line. If you need help in using SoyWater, contact UNL Emeritus Professor Jim Specht at jspecht1@unl.edu
If you determine a calendar date by counting all nodes on the plant to get an approximate age of the plant (see video), it may not be quite as accurate as knowing the actual emergence date of the plant or using the SoyWater model. This is because the 3.7 day node accrual doesn’t officially begin until V1. However, for quick in-field diagnosis, it does provide a ballpark estimate for potential plant age and a time-frame of injury.
Summary
This forensic method has been used by Nebraska Extension faculty the past two years and has worked well in providing a potential time frame for off-target dicamba injury occurring from tank contamination or from other crops. We’ve only tested this method for off-target dicamba injury and not injury from 2,4-D or other herbicides. You can view all dicamba-related information from CropWatch here.
References
Bastidas, A.M., T.D. Setiyono, A. Dobermann, K.G. Cassman, R.W. Elmore, G.L. Graef, and J.E. Specht. 2008. Soybean sowing date: The vegetative, reproductive, and agronomic impacts. Crop Science. 48:727-740.
Fehr, Walter R. and Charles E. Caviness. 1977. Stages of soybean development. ISU Special Report 87.
Kalve, S., D. DeVos and G.T.S. Beemster. 2014. Leaf development: A cellular perspective. Frontiers in Plant Science 5:362.
Klein, Robert, Amit Jhala, Randy Pryor, Stevan Knezevic, Jenny Rees, and Todd Whitney, Can We Manage Dicamba Applications in 2018?, CropWatch.unl.edu, Feb. 15, 2018.
Proost, Richard and Chris Boerboom. Dicamba Injury to Soybeans, University of Wisconsin Nutrient and Pest Management.
Pryor, Randy, Robert Klein, Amit Jhala, Stevan Knezevic, and Jenny Rees. Removing Dicamba Residues from Your Sprayer: A Tricky Task. UNL CropWatch, Feb. 15, 2018.
Rees, Jenny, Jim Specht, Randy Pryor, Todd Whitney, Amit Jhala, Robert Klein, Stevan Knezevic, Potential Off-Target Dicamba Movement from Corn Applications, UNL CropWatch.unl.edu, Feb. 15, 2018.
SoySim — Soybean Grown Simulation Model, University of Nebraska-Lincoln.
SoyWater - Station-Specific Weather and Crop Water Use, University of Nebraska-Lincoln.
Specht, Jim and Haishun Yang, Using SoyWater to Schedule Irrigation and Monitor Soybean Stages to Guide Decision-Making, CropWatch.unl.edu, June 26, 2017.
