Maps are used to provide spatial representation of data, especially climate and weather data. Rain is commonly displayed as a map to show the value and distribution of rainfall over certain periods of time and land areas.
Many of these maps will look different and seemingly display slightly different rainfall amounts, even though the region and timeframe are the same. This is due to the source of the data and how the observations were transformed into a colorful contour map.
Common Rainfall Maps
The three most common types of rainfall data maps are:
- single-point station data,
- interpolated station data, and
- radar-estimated rainfall data.
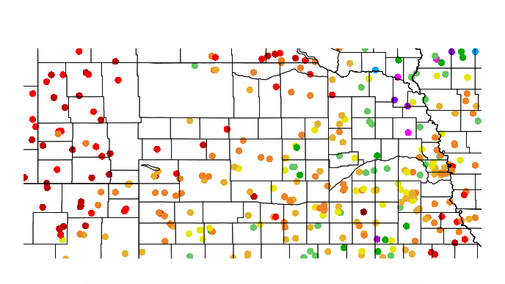
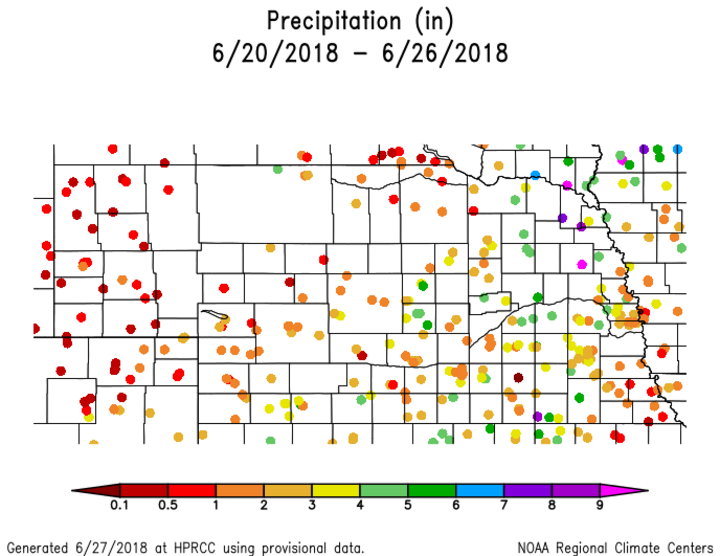
Single point data (Figure 1) is the most accurate depiction of rainfall. This is directly measured and leaves very little for interpretation. The challenge, especially in rural areas, is official precipitation measurements can be few and far between. This can leave wide gaps for those trying to monitor precipitation over an area, especially with the variability of convective precipitation common in the spring and summer. (One way you can close this gap is to join the CoCoRaHS Network and officially measure precipitation.)
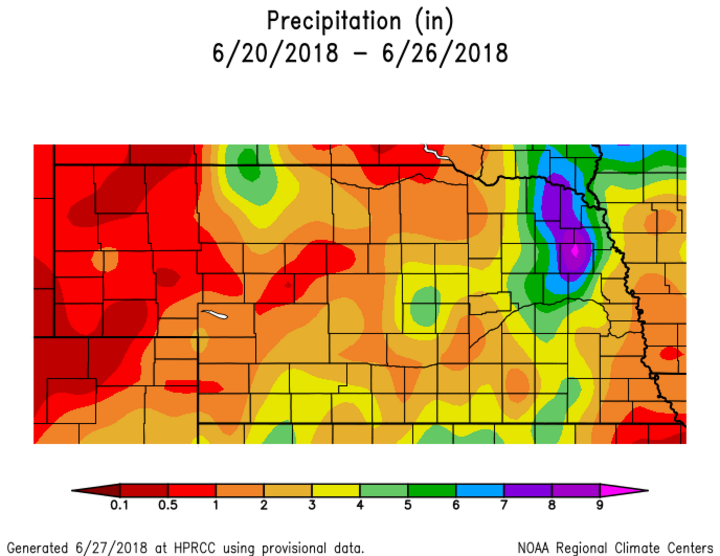
Interpolated station data maps (Figure 2) use the single point station data mentioned above and provide estimated (interpolated) rainfall values of what “may” have been received in between the stations using a grid pattern. There are many interpolation methods to do this and they commonly use statistics or area weighted-average to provide an estimated value based on the stations nearest to the grid point of interest. Variations in interpolation methods will alter the value assigned to the grid point. No matter the method, the values between stations are estimates.
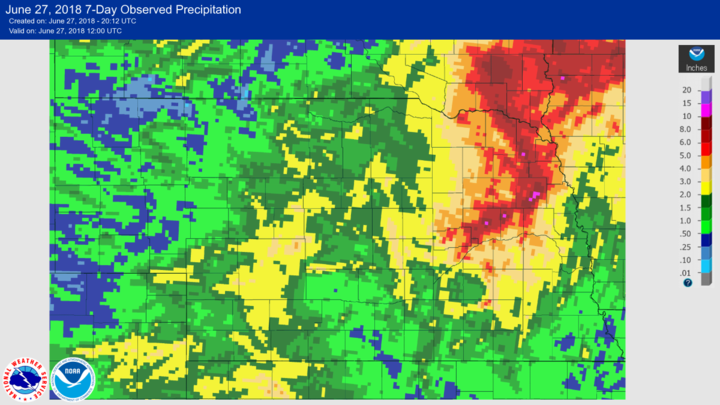
Radar-estimated rainfall maps (Figure 3) provide a map based on radar signature returns. Radar provides a reflectivity value based on water droplet size and distribution over a period of time, thus providing an estimated rainfall rate. There can be errors in radar returns due to hail, uneven droplet size, distance of precipitation from radar, storm height, and curvature of the earth’s surface. These errors will inevitably lead to errors in the estimated rainfall maps. These maps do provide a nice way to see general locations of heavy rainfall (or no rainfall), as well as the variability within a rainfall event, but amounts may be off significantly unless the map has been corrected based on other data.
With all of these maps, you will get some discrepancies based on the period of time the precipitation occurred. The map may show 24-hour precipitation ending at midnight or at 7 a.m. (most common). A time zone difference, as is the case in western Nebraska, also may alter the map’s depiction if it occurred during the cutoff time.
Another challenge is that there are many types of weather observation stations and networks that are unconnected. The timing of collection, collection methods, and even some proprietary data limit the ability for one map to include all of the stations and recorded data.
When looking at these maps, take a look at what the map is actually showing you, or not showing you, and make decisions accordingly. Most maps list the source, so take a minute and search that source and see how the map and data are produced. My recommendation is to look at single-point data, as well as radar-estimated or interpolated data to get the best estimate of what happened in a certain area.
Additional Resources
CropWatch offers several precipitation maps and the supporting data in the CW Weather Section. It also links to NeRain, a citizen network to monitor and report precipitation across the state.
