Information needed to use the Nitrogen Rate Slide chart (EC168):
- Soil organic matter in percent for the top 8 inches.
- Expected yield in bu/ac.
- Soil nitrates in average ppm.
- Expected price for corn in $/bu and cost of nitrogen in $/lb.
| Side 1. Determining the nitrogen rate for given soil conditions. | |||
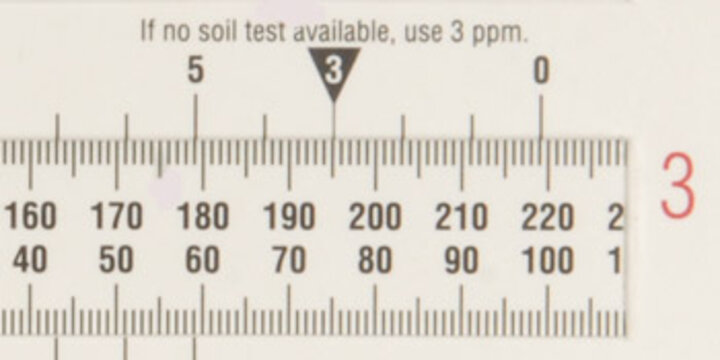
| Step 1 | Set slide chart on top of Side 1 so that expected yield is below soil organic matter. At the open triangle, read the factor at the bottom of the first window. For example, set 200 under 2%; the factor should read 56. |
|
|
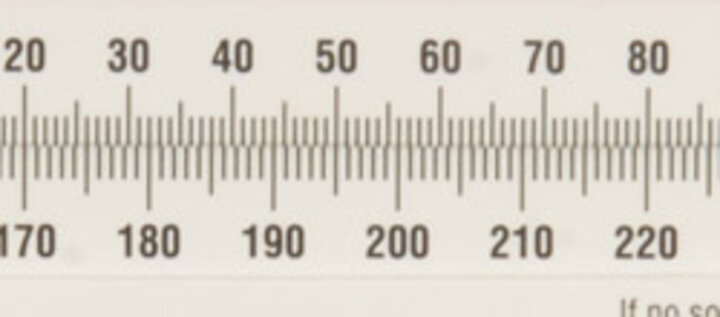
| Step 2 | In the second window, set the expected yield of 200 to the Factor determined in Step 1. Continuing the example from Step 1, set the expected yield of 200 to line up with a factor of 56. |
|
|
| Step 3 |
On the slide across from the 3 at the bottom of side 1, the nitrogen recommendation is read opposite the average ppm. When there soil test results aren't available, use 3 ppm for fine textured soils and 1 ppm for coarse textured soils. For example, with 2% organic matter and 200 bu/ac yield expectation, the N rate should read 195. If the soil nitrate ppm is 9, the N rate should read 147. Other credits will need to be subtracted from this value, such as for soybeans (45) and irrigation water nitrates. Note: if the soil nitrates are given in lbs N/ac, convert by dividing the lbs N/ac by the number of feet in the sample x 3.6. For example, if there is 100 lbs of N in 2 ft of soil, the 100 lbs is divided by 7.2 and there is an average ppm of 14 ppm (N rate is now 107); if the sample was from 3 ft, the number is 10.8 and there is an average of 9 ppm. |

|
|
|
Side 2. Determining the corn:nitrogen price ratio (C:N). |
|||
| Step 4 |
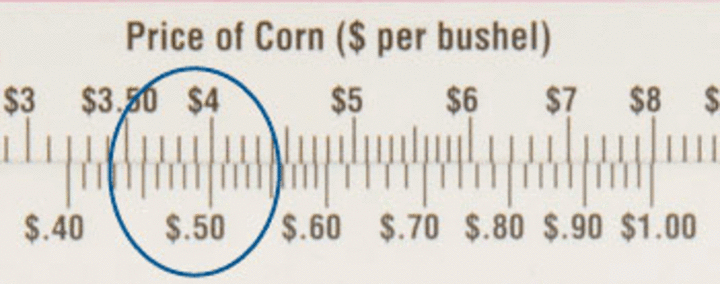
Set the price per pound of applied N below the price expected for corn. The C:N ratio is shown at the black down arrow. For example, at $4.00 corn and $ 0.50/lb N the ratio is 8. |
|
|
| Step 5 |
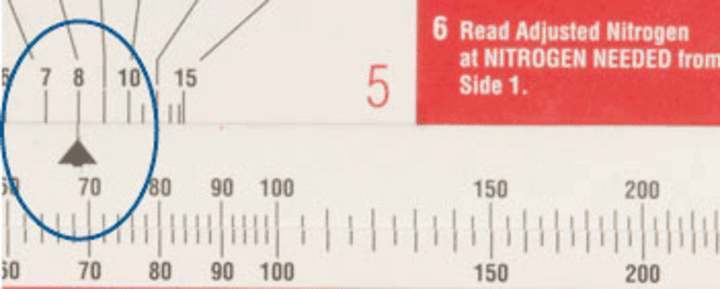
Set slide so that the up facing black arrow in window 6 is under the desired C:N ratio. |
|
|
| Step 6 |
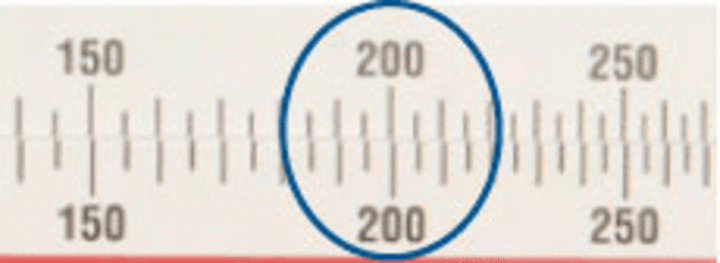
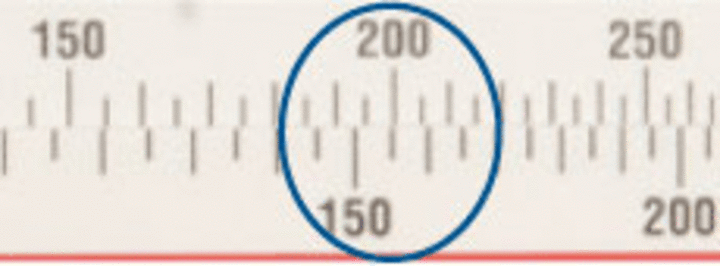
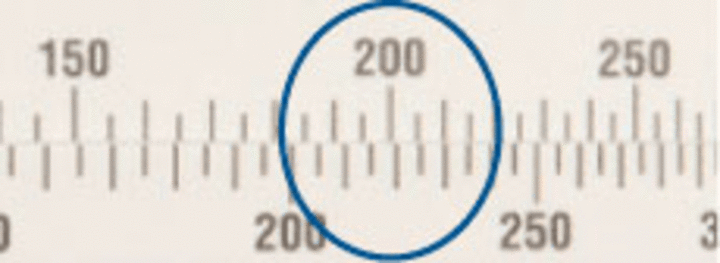
The N rate on the moving slide across from No. 6 is the N rate determined on Side One. Find the value on the moving slide and determine the value on the nonmoving scale. For example, at a C:N ratio of 8, both scales should line up so that the N rates are the same. If the ratio is 5 ($4 corn: $0.50 N) the 195 lb N recommended N rate for 3 ppm soil nitrates from Side 1 is changed to about 152 lbs N. If the C:N ratio is 10, the same 195 lb N recommendation is now 215. |
|
|
| C:N Ratio of 8 | |||

|
|
||
| C:N Ratio of 5 | |||

|
|
||
| C:N Ratio of 10 | |||
Note
This slide rule is a simplification of the N recommendation procedures documented in the Corn Nitrogen Recommendations Calculator. This free calculator is available as a download from the Soil Management page of CropWatch and is based on the Nebraska Extension resource, Fertilizer Suggestions for Corn (EC117).
More Information
For information on ordering the tool, see the related CropWatch article, Nitrogen Slide Rules Back in Stock.
