This is the fifth article of CropWatch's digital agriculture series (DA), “How Digital is Agriculture in Nebraska?” See the links below for more.
Articles in this Series:
Part 3: Barriers to Adoption of Digital Agriculture in Nebraska
Part 4: Top Five Digital Agriculture Technologies Used in Nebraska
Part 5: DAWN Dashboard: A Decision Support Tool for the Corn Belt
Our Nebraska Digital Ag Survey indicated that digital dashboards have been adopted by three out of 10 farmers. Digital dashboards are considered decision support tools that can guide farmers in the decision-making process in their operations with the goal of increasing efficiency, productivity and sustainability of their farms. Data-driven decisions are a key goal for digital agriculture. In this article, we are highlighting the Dashboard for Agricultural Water and Nutrient Management (DAWN), developed by a team of universities as part of a USDA NIFA grant.
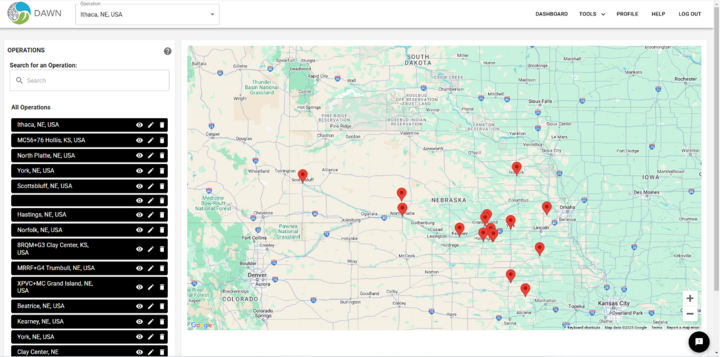
The DAWN Dashboard applies an innovative forecasting and risk analysis system to provide farmers and water managers across the Corn Belt with the most relevant and reliable information for farm-level decision-making. DAWN is an online toolkit for Corn Belt row crop producers that’s designed to support – and better inform – common water- and nutrient-management decisions. Driven by a state-of-the-art regional forecast system, DAWN empowers farmers to make decisions based on accurate seasonal forecasts rather than historical trends.
The University of Nebraska-Lincoln is involved in this project and contributes to the development of a new irrigation scheduling tool and with extension efforts to advocate for the use of the dashboard across Nebraska.
Why Use DAWN?
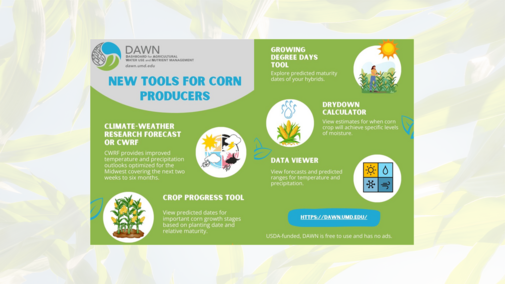
- Driven by global forecast from the National Oceanic and Atmospheric Administration (NOAA) and Corn Belt-specific Climate-Weather Research Forecasting (DAWN-CWRF) forecast model.
- Seasonal forecasts (one- to six-month outlooks) for strategic planning decisions
- Interactive and customizable.
- All data is fully secure and confidential.
- Cost-free, no ads.
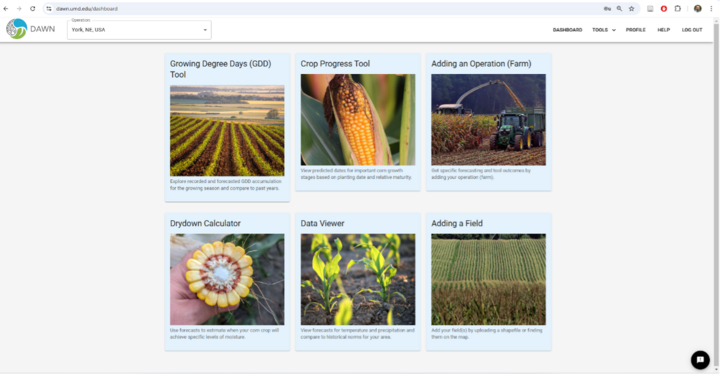
Available Tools
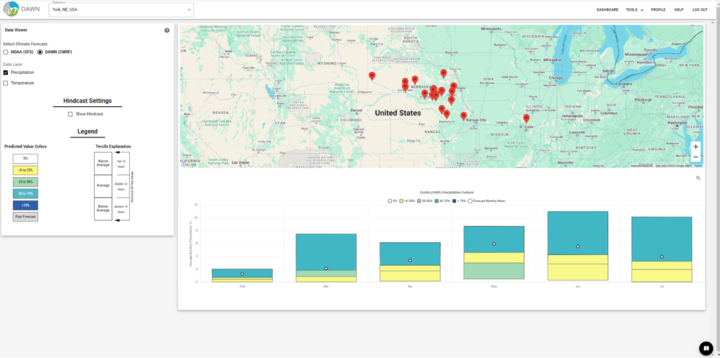
- Data viewer: Gives farmers predicted ranges and associated likelihoods for average monthly temperature and precipitation outlooks.
- Growing Degree Tool: Gives farmers estimates for predicted maturity dates comparing to previous years based on your location, planting dates and relative maturity values.
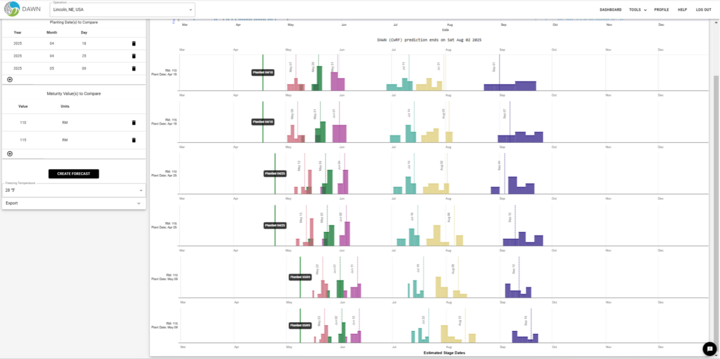
- Crop Progress Tool: Gives farmers predicted dates for important crop growth stages based on your location, planting dates and relative maturity values.
- Dry Down Calculator: Predicts when your corn will reach a target grain moisture date based on starting moisture and observed maturity date (black layer, R6).
Links to DAWN Dashboard and Training Materials
- DAWN website: https://dawn.umd.edu/
- DAWN Dashboard free registration/guest log-in: https://dawn.umd.edu/login
- YouTube channel: youtube.com/@dawn.project (tutorials and training)
- Email: dawn.nifa@gmail.com
- Follow us on X: https://x.com/DawnProj
- Facebook https://www.facebook.com/TheDAWNProj
If you are interested in providing feedback or participating in our focus groups regarding these and upcoming Digital Agriculture tools, please send an email to Guillermo Balboa (Subject: DAWN testing).
Stay tuned for our sixth article in the series, focusing on Nebraska farmers' use of digital agriculture tools to manage nitrogen in corn fields across Nebraska.
DAWN is supported by the United States Department of Agriculture-National Institute of Food and Agriculture, grant number: 2020-68012-31674.
DAWN Project Members

References
Liang, X.-Z., Gower, D., Kennedy, J.A., Kenney, M., Maddox, M.C., Gerst, M., Balboa, G., Becker, T., Cai, X., Elmore, R., Gao, W., He, Y., Liang, K., Lotton, S., Malayil, L., Matthews, M.L., Meadow, A.M., Neale, C.M.U., Newman, G., Sapkota, A.R., Shin, S., Straube, J., Sun, C., Wu, Y., Yang, Y., Zhang, X., 2024. DAWN: Dashboard for Agricultural Water Use and Nutrient Management—A Predictive Decision Support System to Improve Crop Production in a Changing Climate. Bull. Am. Meteorol. Soc. 105, E432–E441. https://doi.org/10.1175/BAMS-D-22-0221.1
