The Testing Ag Performance Solutions (TAPS) program has concluded its seventh year of the sprinkler irrigated corn farm management competition at the West Central Research, Extension and Education Center in North Platte, Nebraska. One of the most interesting observations is the year-to-year variability in corn yield response to irrigation and nitrogen (N) fertilizer rates. As observed by many producers and crop advisors in the area, the irrigation requirement was highly dependent on the amount and distribution of annual rainfall. Similarly, the response of corn yields to N fertilizer across the TAPS years also varied.
Due to limited space, only the years with maximum and minimum irrigation requirements and N response are included in this discussion.

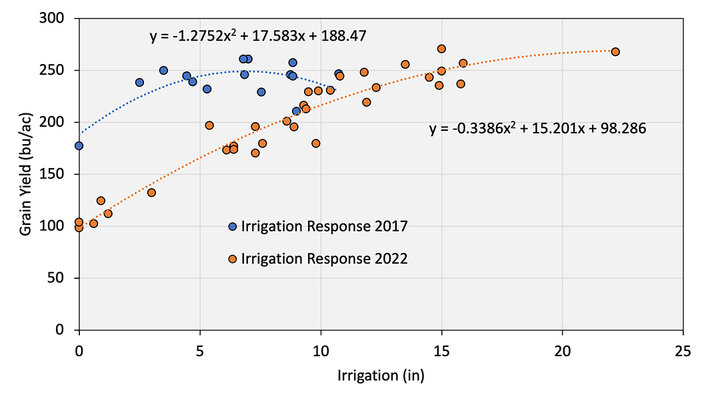
Corn grain yield response to irrigation for 2017 (above average rainfall) and 2022 (below average rainfall) is presented in Figure 1. 2017 showed an optimal irrigation application of not more than seven inches. In contrast, the optimal amount was 15 inches or more in 2022, with an average increase of 15 bushels per applied inch.
This wide swing in optimal irrigation was primarily due to weather variability. However, observing the difference in precipitation and irrigation between the two years was interesting. The difference in seasonal (May 1-Sept. 30) rainfall between 2017 and 2022 was approximately nine inches (18.2 inches in 2017 vs. 8.95 inches in 2022). When you add the optimal irrigation amount and seasonal rainfall, the sum is 24-25 inches for both years.
In 2017, five rainfall events exceeded one inch, but it was dry in June and in late August/early September. In contrast, there were only two rainfall events that exceeded one inch in 2022. However, there was a higher difference in maximum and minimum irrigation among competing producers between the two years (eight inches in 2017 vs. 22 inches in 2022).

The Census of Ag Irrigation and Water Management Survey – 2018 results indicate that over 82% of the Nebraska respondents use the condition of the crop to schedule irrigations, while 48% use the hand feel of the soil method. These two methods are more prevalent than the use of scientific-based methods of soil moisture sensors (31%), plant sensors (2%), and crop water use information (i.e., evapotranspiration, ET) at 21%. Almost 7% reported watching the neighbors to schedule their irrigations. With rising costs of pumping water, declining groundwater levels and groundwater quality concerns in portions of Nebraska, it is becoming more important to use available technology and tools to pump only as much water as we need.
The TAPS program provides participants with the experience of trying this technology on the TAPS plot before adopting onto their farming operation. Kennedy and Burbach (2023) survey results indicate that 75% of TAPS participants reported adopting new ag technology and 86% have adopted new ag management practices, at least on a trial basis on their farm. In addition, 28% of participants reported that they adopted new technology and 38% adopted new management practices on more than 50% of the land they farm as a result of participating in TAPS.
Not surprisingly, there were considerable year-to-year differences in the optimal N fertilizer rate. These differences are likely due to year-to-year variability in weather conditions, soil organic matter mineralization, amount of residual N, and N from irrigation water, etc. While the amount of N available to the crop from residual N and N from irrigation water can be measured, the amount of N mineralization is harder to estimate. Environmental factors that promote high rates of mineralization include: warm soil temperatures (50-85oF); soil pH between 5 and 8; good soil drainage; and moist but not overly wet soils (Hoeft et al., 2000).

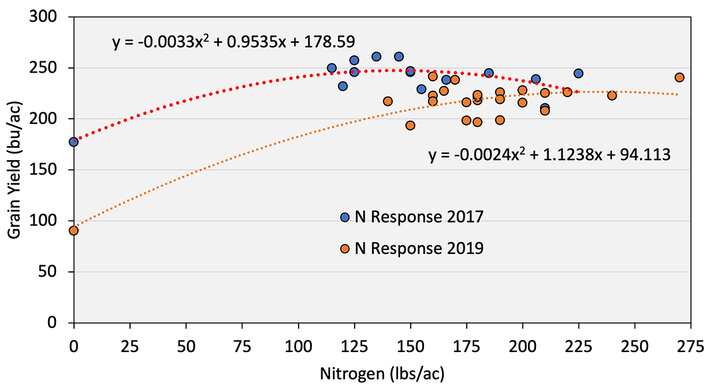
During 2017, the highest crop yield of 257 bu/ac was observed at an N rate of 135 lb N /ac, while N rates higher than 135 lbs N/acre did not improve crop yields. In 2019, a better correlation existed between N application and yield, with higher amounts of N required for higher yields.
One indicator of the amount of N released by mineralization in the TAPS plots is the yield of the control plot, which receives no added nitrogen or irrigation water. In 2017, the control plot yielded 177 bu/ac. In contrast, 2019 had a much lower control plot yield of 90 bu/ac. Since the plots were located in the same field with the same previous crop and pests managed according to UNL recommendations, the differences between the two years could be attributed to differences in weather conditions that affected N mineralization and therefore, N availability. A local weather station at Gothenburg saw maximum daily soil temperatures exceed 50°F for 17 days in March 2017 and only four days in March 2019.
Excluding 2023, the hailed year, the UNL nitrogen calculator with a yield goal of 270 bu/ac was used to determine N recommendations with grain and nitrogen prices held constant across years. Across the six years, the UNL nitrogen calculator rate only limited yield in 2020, when a higher yield was achieved with higher N application. In this situation, the UNL nitrogen calculator recommended rate still reached the yield goal of 270 bu/ac that year. Based on these results, if growers and crop advisors are using rates above the UNL nitrogen calculator recommendations, the data would show that they are overapplying and spending more money on fertilizer than is required in most years.

TAPS’s greatest yields for the 2017-2023 years were 261, 288, 241, 295, 274, 271 and 212 (hailed) bu/ac, respectively. Most growers experience similar yield variability from year to year. The variability in optimal N rate ranged from 135 lbs N/ac to 220 lbs N/ac, which shows that applying the same N rate every year is not an economically or environmentally sound practice. N management needs depend on crop and weather conditions that fluctuate drastically from year-to-year and should also account for crop and N fertilizer price variability.
Given the year-to-year variability of optimum N rate is often dependent on weather conditions and associated N credits and grain and fertilizer prices vary as well, we highly recommend assessing the N credit through soil sampling, irrigation water sampling, and adjusting for these credits in N recommendation tools, such as the digital UNL N calculator and crop canopy reflectance. We further suggest determining a base rate and adjusting in-season crop N requirement using in-season N recommendation tools, such as fertigation applications based on sensor or imagery data. There are numerous crop canopy sensors, as well as satellite, aerial and drone imagery platforms that can be used to help identify optimal rate of N. Check out the following projects:
For more information on the UNL-TAPS competition results, check out our website and click on the Reports tab.
Resources
Hoeft, R. G., E.D. Nafziger, R.R. Johnson and S.R. Aldrich. 2000. Modern Corn and Soybean Production. MCSP Publications.
Kennedy, S. M. and M.E. Burbach. TAPS Program Evaluation – Producers, Open-File Report 233. 2023.
