As farmers embark on another growing season in Nebraska, most will be applying some form of nitrogen fertilizer to optimize crop production. Organic nutrient sources, such as manure and compost, have been used by farmers for thousands of years. Inorganic fertilizers have only been available commercially for slightly more than a century. Significant supplies of nitrogen fertilizers only became available to Nebraska farmers in the early 1950s following World War II, as nitrogen used for munitions became available for agricultural use.
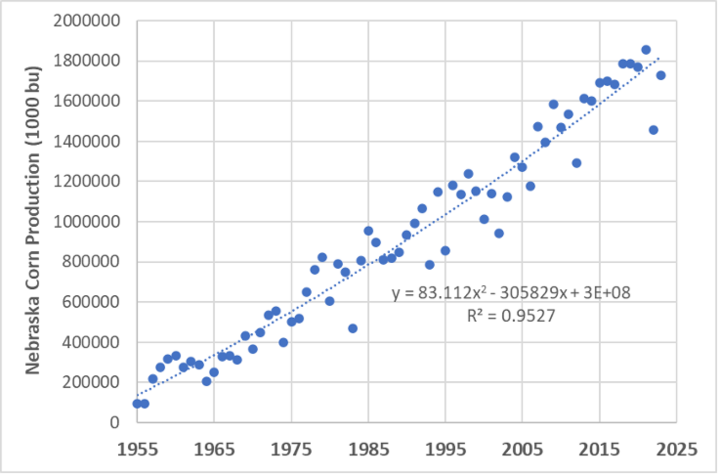
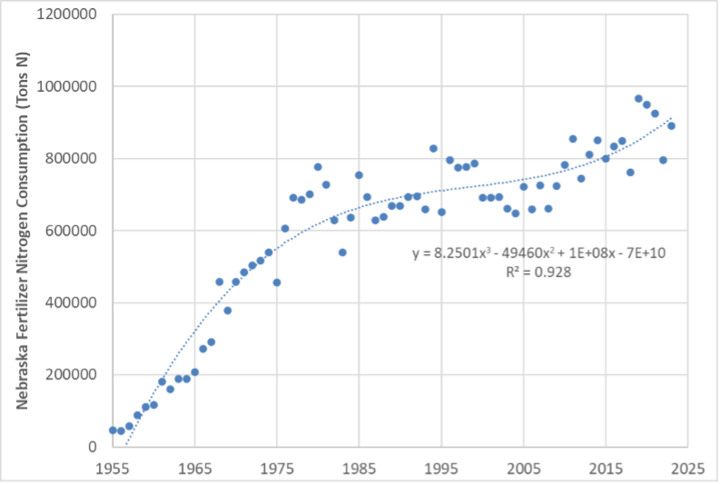
The USDA National Agricultural Statistics Service (USDA NASS) and the Nebraska State Department of Agriculture collect information that is very informative about trends in fertilizer use in the state. Most of the nitrogen fertilizer used in Nebraska has been for corn production. Figure 1 illustrates total corn production in Nebraska from 1955 to 2023, showing a steady increase in production over almost 70 years. Figure 2 shows nitrogen fertilizer use over the same period, from six primary nitrogen fertilizer sources: anhydrous ammonia, ammonium nitrate, ammonium sulfate, ammonium thiosulfate, urea, and urea ammonium nitrate solution. Fertilizers which primarily contain other nutrients, but also some nitrogen, are not included in this figure (such as ammonium polyphosphate, monammonium phosphate, and diammonium phosphate). Consumption of inorganic fertilizer nitrogen from these six sources grew from around 47,000 tons of N in 1955 to a peak of over 960,000 tons of N in 2019.


Figure 3 shows trends in nitrogen fertilizer sources over this period. Initially, ammonium nitrate, mostly sold in bags, and anhydrous ammonia were the dominant fertilizer sources. Nitrogen fertilizer use grew steadily from 1955 into the 1970s as fertilizers became more available and farmers saw the benefit for crop production. During this period, urea and urea ammonium nitrate solutions became more available and their use grew. Anhydrous ammonia dominated fertilizer sales during this period, peaking in 1968 with over 75% of total N sold as anhydrous ammonia.
Use of urea ammonium nitrate (UAN) solution (both 28% and 32% N) began to take off in the 1980s, and today is the most dominant form of nitrogen fertilizer used in Nebraska. In 2022, 57% of all N consumed in Nebraska came from UAN solutions, while 23% came from anhydrous ammonia, and about 14% from urea.
Total nitrogen used in Nebraska began to plateau around 1980 until about 2010. Since then, trends for increasing total N use have been observed. This trend generally coincides with an increase in land area from which corn is harvested. Approximately 8.85 million acres of corn were harvested in Nebraska in 2010, while 9.5 million acres of corn were harvested in 2023.


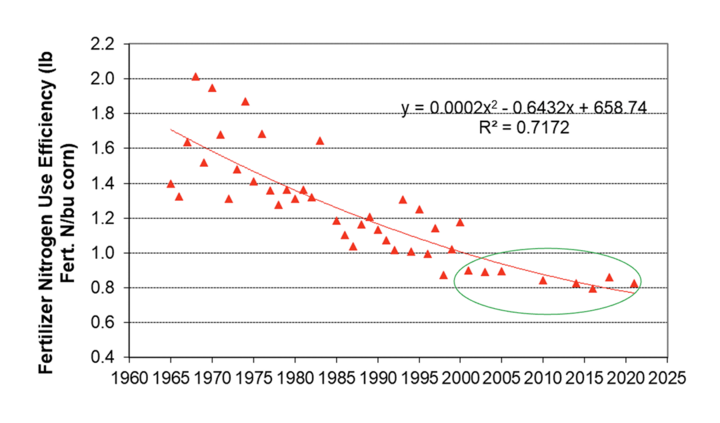
Figure 4 combines information about corn production and fertilizer use, generating the statistic of fertilizer nitrogen use efficiency — the mass of fertilizer nitrogen used to produce a bushel of corn. Data for this figure is produced from surveys of farmers’ practices conducted periodically by USDA NASS, and from USDA NASS reports of average grain yield. Nitrogen fertilizer rates are those reported by farmers. These surveys used to be conducted annually, but today occur every two to three years, with the most recent survey in Nebraska in 2022.
Figure 4 shows a very positive overall trend, with fertilizer N use of around 1.6 to 1.7 pounds fertilizer N per bushel of corn in 1965, to around 0.8- to 0.9-pound fertilizer N per bushel of corn in 2022. This positive trend illustrates that Nebraska farmers have become much more efficient through the years in managing nitrogen fertilizer.
There are many factors influencing this trend, including genetics advances and overall improvement in production practices. However, it’s likely that a major factor in this trend has been growing awareness of the risk of environmental degradation from excessive nitrogen application, influenced by many educational programs conducted by the University of Nebraska-Lincoln and natural resources districts. This trend is also influenced by requirements in some groundwater management areas for producers to follow nitrogen and irrigation best management practices.
While the general trend for the past 60 years is positive, Figure 4 also shows very little change recently in fertilizer nitrogen use efficiency: it has remained around 0.8- to 0.9-pound fertilizer N/bu since 2000 (circled data points). This data also does not illustrate variations in efficiency that occur in regions across the state. This lack of recent improvement suggests that current widely used practices may have reached their limit in terms of nitrogen use efficiency, and adoption of other tools, such as in-season application and sensor-based fertigation, may be required to further increase nitrogen use efficiency.
