A well-maintained center pivot is designed to operate with a uniformity of water application (UWA) of over 90%. However, factors such as natural wear and tear of the sprinkler package and installation or replacement of nozzles with improper sizes can reduce UWA, ultimately reducing yield. The negative impact of low UWA is generally larger during dry growing seasons when total irrigation water requirement increases. This was a norm in 2022 and 2023 at several locations in Nebraska. As irrigation water requirement increases due to the low rainfall amounts, reduction due to low UWA will also increase.
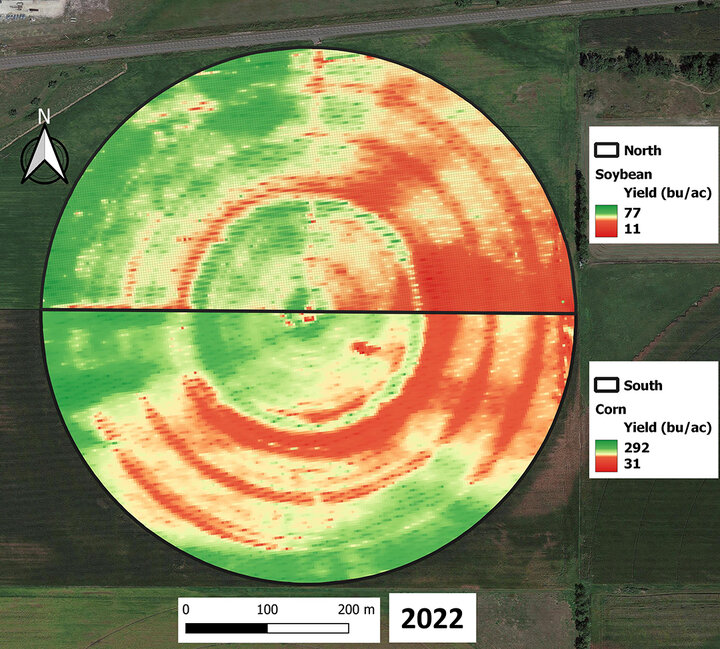
During a conversation with a grower in southeast Columbus, Nebraska, concerns were expressed about one field under a center pivot. The grower mentioned that he had lower than expected yields (Figure 1) and he was wondering if the issue was related to low UWA. After analyzing his yield map, we were able to identify an area of the field with substantial yield reduction. These areas resembled rings sometimes one-fourth of a span length. Clearly, that pivot needed some maintenance.
In this article, we are highlighting the main findings of an extension project for which the objectives were (1) assess the UWA of three center pivots before and after replacing the nozzles, and (2) assess the potential negative impact associated with low UWA on crop yield. We would like to thank the Nebraska Soybean Board for the financial support of all costs related to this project. The new nozzle package replacements and supplies to assess UWA was only possible with checkoff dollars.
Case Studies
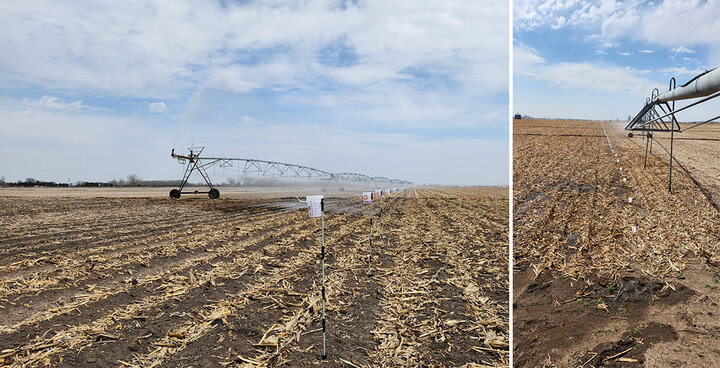
In 2023, we conducted what is called the “catch-can test” at three center pivots in eastern Nebraska. The test is quite simple. We set up cups attached to electric fence posts every nine to 10 feet. We then turned on the pivot and ran it over the cups. We determined the irrigation depth collected at each cup and we used this data to calculate the UWA for each center pivot. Figure 2 is a snapshot of the cups underneath the center pivot.
We conducted two catch-can tests in each of the three tested center pivots — one before and another after replacing the center pivot with the new nozzle package, allowing to determine the improvement in UWA.
Uniformity of Water Application
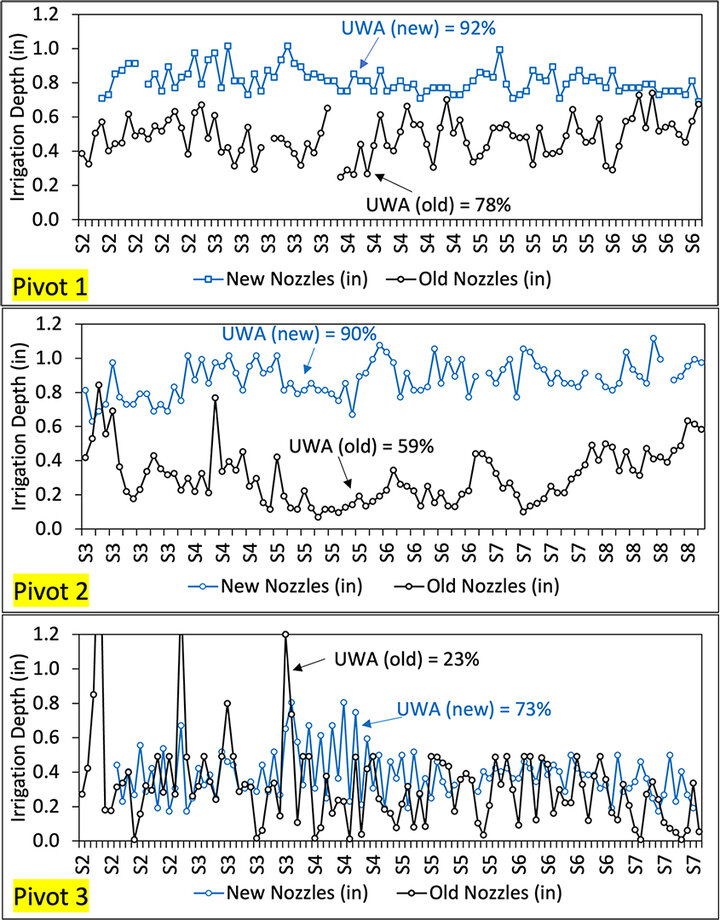
Figure 3 illustrates the catch-can test results for the three center pivots. The irrigation depth — represented by black and blue lines — corresponds to the old and new nozzle packages, respectively. Initially, pivots 1, 2 and 3 exhibited UWA values of 78%, 59% and 23% with the old nozzles, as these pivots had received minimal maintenance attention since their initial installation. Growers noted that these pivots were 21, 34 and 38 years old, still equipped with the original nozzle package.
Following the replacement of nozzles, all pivots demonstrated improvements. UWA increased to 92%, 90%, and 74% for pivots 1, 2, and 3, respectively. While pivots 1 and 2 met the manufacturer's recommendation of at least 90% UWA, pivot 3 still fell short of the recommended values. Upon discussing this with the grower of pivot 3, it was revealed that the primary reason for the suboptimal UWA was the pumping capacity.
The second catch-can test took place in October 2023, coinciding with a depleted groundwater level that affected pumping capacity. Despite being designed for a 500-gallons-per-minute operation, the grower suspected that the pump was running at approximately 350 gallons per minute or lower during the catch-can test.
A follow-up test is planned for spring 2024, contingent on groundwater levels allowing the pump to operate at its intended rate.
Potential Yield Loss Due to Low UWA
For optimal crop production, it's crucial that a center pivot distributes water uniformly across the field. Any deviations in yield from the overall field average are typically linked to natural variations in the field. However, if the pivot system is not ensuring UWA, it is likely that specific areas within the same field will experience significantly lower yields.
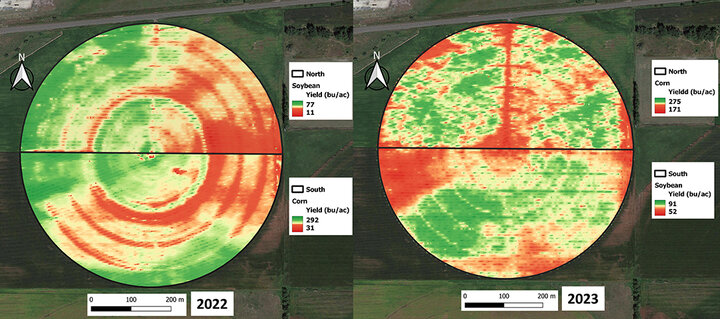
This was evident in 2022 when observable differences in yield values were noted within the field (see Figure 4 – left). Assuming that these disparities were caused by inadequate UWA, we can quantify the yield gap between the average and the underperforming areas. After implementing a new nozzle package on the pivot, we anticipate a reduction in this gap due to improved UWA, as observed in Figure 4 (right).
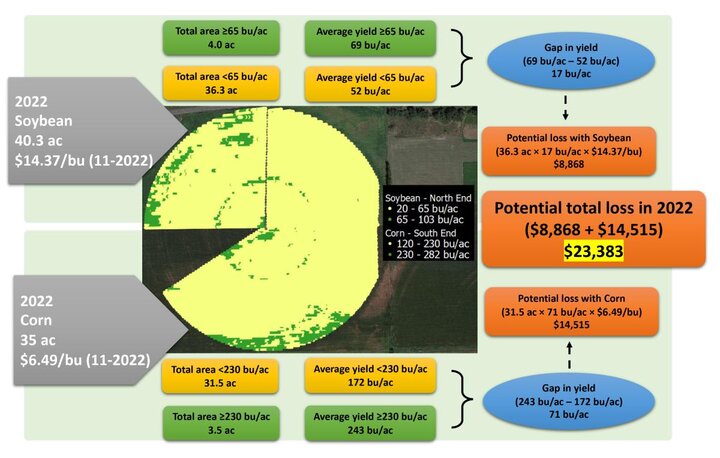
The infographics presented in Figures 5 and 6 show the calculation process to estimate yield losses in 2022 and 2023, respectively. Before conducting this analysis, we asked the growers what the expected yield average values for all his operation was, allowing us to set a baseline data for the analysis. He mentioned that yield average for all his operation would be at least 65 bu/ac for soybean and 230 bu/ac for corn.
Our assumption was that any recorded yield values falling below the 65/230 bu/ac threshold were likely attributable to low UWA. This held true in 2022 when the pivot was equipped with the old nozzles. However, with the subsequent replacement of the nozzles in 2023, we anticipated finding yield averages either close to or exceeding the 65/230 bu/ac threshold.
In 2022, a substantial portion of the area yielded below the grower's specified threshold (see Figure 5), exemplifying the impact of an inadequately maintained center pivot. Approximately 36.3 acres fell below the threshold, averaging a yield of 52 bu/ac for soybeans. Similar trends were observed in the corn field, with 31.5 acres below the threshold and an average yield of 172 bu/ac. This discrepancy from the farmer's anticipated yield values resulted in a significant potential yield loss for both soybeans and corn, amounting to approximately $9,000 and $14,500, respectively — totaling about $23,500.
The total cost for the replacement of the nozzle package, including labor, was $6,500 in April 2023. If the grower had opted to replace the nozzles before the dry 2022 growing season, and assuming the field would have averaged above 65/230 bu/ac, the investment could have been recouped, yielding a profit of approximately $17,000. This highlights the economic benefits of proactive maintenance and timely equipment upgrades.
Examining the 2023 yield map (Figure 6), the positive impact of yield stabilization is evident following the installation of the new nozzle package. Both the corn and soybean fields exhibited a notably reduced percentage of the area falling below the 65/230 bu/ac threshold. This not only narrowed the yield gap but also mitigated losses. In 2023, we attributed the potential total loss of $1,425 to special variability within the field, considering that the pivot maintained uniform water application across 92% of the entire field.
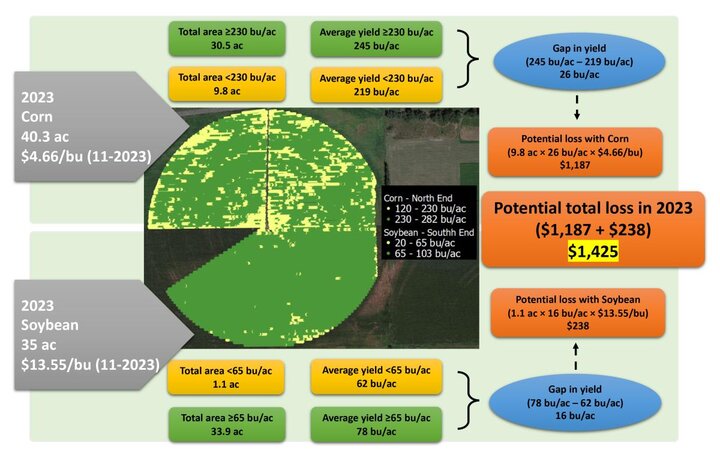
It's crucial to emphasize that the site experienced intensified drought conditions in 2023. Under these circumstances, adhering to the old nozzle package could have resulted in a scenario similar to or even worse than the challenges encountered in 2022. Upgrading and maintaining the pivot system, particularly in the face of varying environmental conditions, is essential to ensure optimal crop performance and minimize potential losses.
Fine Adjustment of the Speed/Depth/Revolution Chart
Despite witnessing a significant improvement in application uniformity with the installation of new nozzles on pivots 1 and 2, we identified inconsistencies between the selected irrigation rate at the panel and the actual irrigation rate measured by the cups. The measured irrigation depth deviated from the depth selected at the pivot panel.
For pivot 1, the selected irrigation rate was 1 in at a pivot speed of 9.6%, but the average measured irrigation depth by the cups was 0.81 inch. Conversely, for pivot 2, the measured irrigation depth by the cups was nearly one time higher than the rate selected at the panel. We opted for a 20% speed, anticipating an irrigation depth of 0.57 inch, but the cups recorded an average depth of 0.95 inch.
To delve deeper into these discrepancies, we initiated another catch-can test at pivots 1 and 2. Running the pivot at three speeds, we collected irrigation depth data for each selected speed and also monitored the pivot travel speed in feet per minute. This allowed us to develop a new calibrated chart incorporating % speed, irrigation depth, and revolution time, as detailed in Table 1 (pivot 1) and Table 2 (pivot 2).
Upon analysis, we observed that pivot 1 consistently applied water at a rate lower than the dealer's provided numbers for the same pivot % speed. In contrast, for pivot 2, the opposite trend was noted, with the irrigation depth consistently exceeding the chart provided by the dealer. These findings highlight the importance of fine-tuning and calibrating irrigation systems to ensure accurate and consistent water application, ultimately optimizing crop performance.
Another crucial aspect is that the additional catch-can test was conducted in October 2023, suggesting the possibility of pivots underapplying irrigation water due to depleted groundwater (lower pumping capacity). Surprisingly, this was not the case. The same difference persisted in the October 2023 test when compared to the test conducted back in April/May 2023. After consulting with one of the dealers, they mentioned that it is common to observe the pivot panel not performing accurately after five years of installation.
Not being aware of whether a pivot is under or overapplying water could result in a cumulative negative impact on crops yield. The grower at pivot 2 consistently selected an irrigation depth of 0.6 inch for each irrigation event (one every four to five days), but the pivot was actually applying around 1.1 inch. After exposing this information to him, he was able to understand why his pivot seemed to be taking longer than expected to apply 0.6-inch. Initially thinking he was falling behind in his irrigation schedule, he even considering increasing his well capacity. However, he changed his mind after we presented these results to him, realizing that the pivot was still delivering the adequate amount of water.
| Dealer’s New Chart | New Calibrated Chart | |||||
|---|---|---|---|---|---|---|
| Speed (%) | Depth (in) | Revolution Time (h) | Speed (%) | Depth (in) | Revolution Time (h) | |
| 5 | 1.93 | 163 | 5 | 1.57 | 151 | |
| 10 | 0.96 | 82 | 10 | 0.74 | 76 | |
| 15 | 0.64 | 54 | 15 | 0.51 | 50 | |
| 20 | 0.48 | 41 | 20 | 0.41 | 38 | |
| 25 | 0.39 | 33 | 25 | 0.3 | 30 | |
| 30 | 0.32 | 27 | 30 | 0.25 | 25 | |
| 35 | 0.28 | 23 | 35 | 0.21 | 22 | |
| 40 | 0.24 | 20 | 40 | 0.19 | 19 | |
| 45 | 0.21 | 18 | 45 | 0.16 | 17 | |
| 50 | 0.19 | 16 | 50 | 0.15 | 15 | |
| 60 | 0.16 | 14 | 60 | 0.12 | 13 | |
| 70 | 0.14 | 12 | 70 | 0.10 | 11 | |
| 80 | 0.12 | 10 | 80 | 0.09 | 9 | |
| 90 | 0.11 | 9 | 90 | 0.08 | 8 | |
| 100 | 0.10 | 8 | 100 | 0.07 | 7 | |
*Note: Numbers in red were measured at the field with the catch-can method.
| Dealer’s New Chart | New Calibrated Chart | |||||
|---|---|---|---|---|---|---|
| Speed (%) | Depth (in) | Revolution Time (h) | Speed (%) | Depth (in) | Revolution Time (h) | |
| 5 | 2.30 | 289 | 5 | 5.88 | 640 | |
| 10 | 1.15 | 144 | 10 | 2.51 | 287 | |
| 15 | 0.77 | 96 | 15 | 1.52 | 179 | |
| 20 | 0.57 | 72 | 20 | 1.09 | 130 | |
| 25 | 0.46 | 58 | 25 | 0.81 | 99 | |
| 30 | 0.38 | 48 | 30 | 0.65 | 80 | |
| 35 | 0.33 | 41 | 35 | 0.54 | 67 | |
| 40 | 0.29 | 36 | 40 | 0.43 | 57 | |
| 45 | 0.26 | 32 | 45 | 0.39 | 50 | |
| 50 | 0.23 | 29 | 50 | 0.35 | 45 | |
| 60 | 0.19 | 24 | 60 | 0.28 | 36 | |
| 70 | 0.16 | 21 | 70 | 0.23 | 30 | |
| 80 | 0.14 | 18 | 80 | 0.19 | 26 | |
| 90 | 0.13 | 16 | 90 | 0.17 | 23 | |
| 100 | 0.11 | 15 | 100 | 0.15 | 20 | |
*Note: Numbers in red were measured at the field with the catch-can method.
While doing this test, a few growers have asked us how often the nozzles should be replaced. Some dealers have mentioned that ideally a nozzle package should be replaced after 10 years, but with the new materials, some dealers have claimed it can last longer. Our recommendation is to conduct a simplified version of catch-can test (with fewer cups) to assess the UWA of a particular pivot before deciding whether or not a nozzle replacement is required. Another way to identify issues is by checking the yield map data, which can provide a good insight of issues regarding to low UWA.
Final Remarks
Some of the findings are highlighted below:
- The catch-can tests conducted on three center pivots before and after nozzle replacement revealed significant improvements in UWA, emphasizing the positive impact of proactive maintenance.
- The potential yield losses associated with low UWA were quantified, emphasizing the economic benefits of timely nozzle replacements.
- The economic analysis demonstrated that the investment in nozzle replacement not only mitigated potential losses but also presented an opportunity for substantial profit.
- The calibration challenges observed in pivots 1 and 2 show the need for fine-tuning and regular calibration of irrigation systems to ensure accurate water application.
Ultimately, this project serves as a valuable resource for growers, emphasizing the benefits of maintaining and upgrading irrigation systems. Proactive measures, including simplified catch-can tests and regular checks of yield map data, are recommended for growers to assess UWA and identify potential issues, minimizing the potential yield losses due to low UWA.
Acknowledgments and Contact Information
We extend our sincere gratitude to the Nebraska Soybean Board for their invaluable financial support, which was essential in the successful execution of this project. Additionally, we express our gratitude to the three growers who actively participated in the project. Their allocation of time and collaboration were imperative in gathering the crucial information presented.
For further inquiries or information, please feel free to contact Bruno Lena at the Platte County Extension Office, 402-563-4901.

