Determining early-season soybean stand count is critical for informed decisions on potential replanting. This study explores the application of drone technology for stand count assessments, emphasizing the need for accuracy and reliability in these digital agriculture tools.
Recent advancements in digital agriculture tools, particularly the utilization of drones equipped with artificial intelligence, machine learning and deep learning techniques offer a new dimension to soybean stand count assessments.
As these technologies becomes more available, questions are raised regarding its accuracy and reliability. Therefore, our team conducted a simplified test during spring 2023 to determine the system performance in relation to field-measured stand count. We used a DJI Phantom 4 Pro V2 Drone to capture the images, and we used a Sentera Field Agent software to collect and process the images, and provide the drone-based stand count.
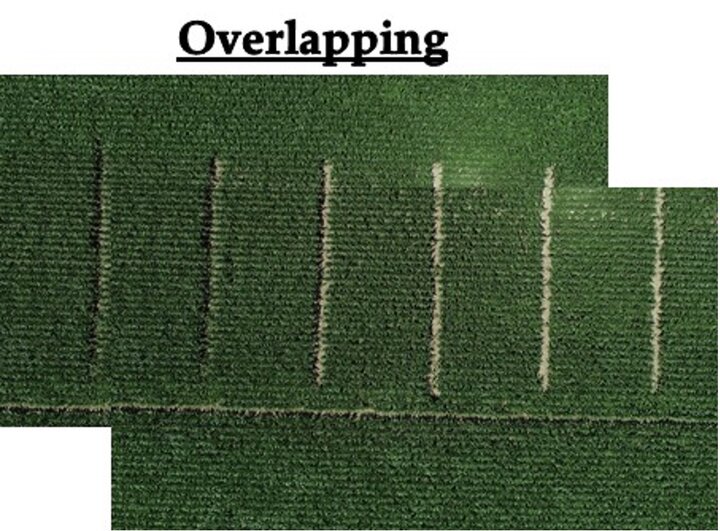
Basics of Overlapping
An example of overlapping is presented in Figure 1. In this case, two pictures overlap at 75%, meaning that 75% of the one figure overlaps the other. Ideally, users would benefit from more overlapping since it improved the field’s picture quality. The drawback is that larger overlapping requires larger number of pictures and therefore, more processing power and time to run the algorithm and assess stand count.

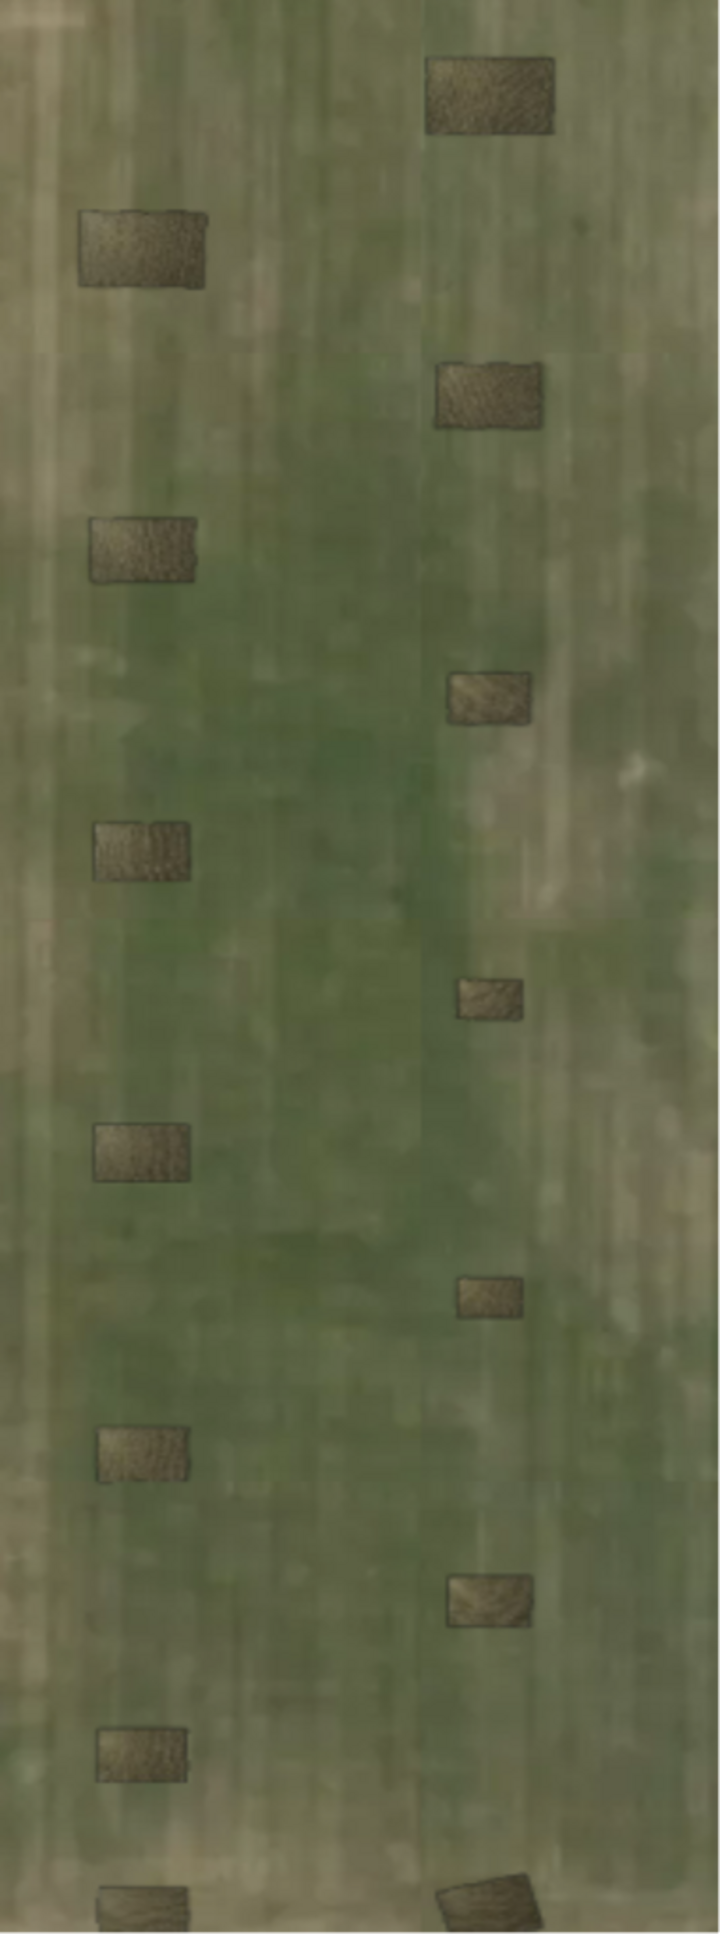
The standard configuration provided by the Sentera Field Agent software is to use a negative overlap of -300% flying at 50 feet above ground. This means that each picture is taken at different locations of the field and they do not overlap (Figure 2). This reduces processing power requirement, and stand count maps are processed faster. The drawback of using -300% is that less pictures are taken from the field.
Testing the Software Performance
We field-measured stand count at 48 locations within the field, covering an area of about six acres. That is an average of eight stand count per acre. The field-measured average stand count was 105,000 seeds/acre. Soybean plants were at V2 growth stage.
The second step was to fly the drone above the same location where we performed field-measured stand count and compare that information with the stand count provided by Sentera Field Agent software. We tried the following configurations:
- Drone flight at 50 feet with -300% (standard).
- Drone flight at 50 feet with 0% overlapping.
- Drone flight at 20 feet with -300% overlapping.
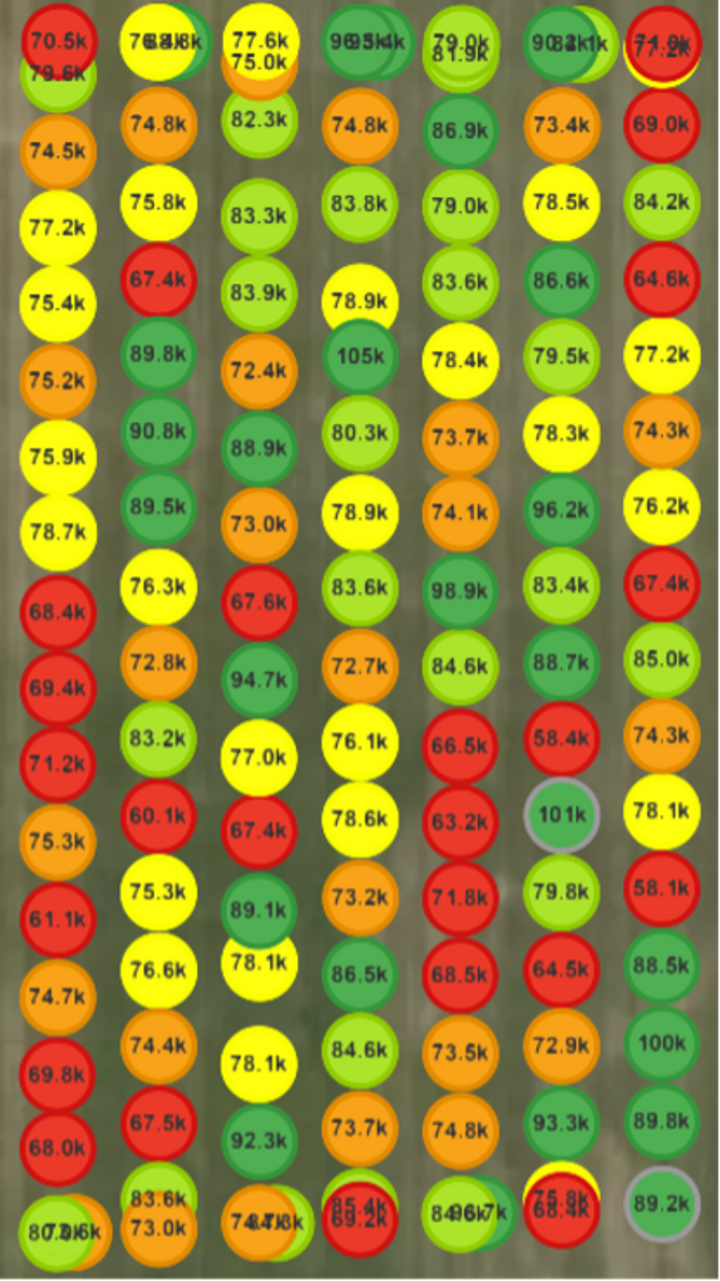
At 50 feet and -300% overlapping, the drone 14 pictures within the six acres (Figure 3). This is 2.3 samples per acre, when doing field measurements. The average stand count provided by Sentera Field Agent software for all 14 pictures was 72,000 plants/acre, about 33,000 plants/ac lower than the field-measured stand count.
Figure 4 shows the spot stand count at 50 feet with 0% overlapping, which means that the pictures were taken side by side, again within the same six acres. Even though the population came a little higher, the average (78,000 plants per acre) is still below the field-measured stand count.
The lowest setting allowed by Sentera Field Agent software is at 20 feet height with -300% overlapping. It does not allow to process anything under -300% at 20 feet. As mentioned before, we believe that the company is limiting this setting due to the increased processing power it would require. The findings given in Figure 5 show the proximity of drone-based stand count (110,000 plants/acre) in relation to field-measured stand count (105,000 plants/acre), showing only 5,500 plants per acre difference.


- Figure 2. Drone pictures at 50 feet and -300% of overlapping.
- Figure 3. Drone spot stand count at 50 feet and -300% overlapping within six acres.
- Figure 4. Drone spot stand count at 50 feet and 0% overlapping.
- Figure 5. Drone spot stand count at 20 feet and -300% overlapping.
Figure 2. Drone pictures at 50ft and -300% of overlapping.
Figure 3. Drone spot stand count at 50 feet and -300% overlapping within six acres.
Figure 4. Drone spot stand count at 50 feet and 0% overlapping.
Figure 5. Drone spot stand count at 20 feet and -300% overlapping. -->
Picture Quality and the Effect on Stand Count
The study findings showed variations in the field-measured vs. drone-based stand count assessment. This was primarily influenced by two key factors. First was the high soybean population selected by the grower (130,000 seeds/ac). At this population and plants at V2 stage, leaves from plants are overlapping each other, which negatively influences plant counting. Secondly, the drone camera's tendency to lose focus during flight introduces challenges, making it harder for the algorithm to count plants due to blurred images.
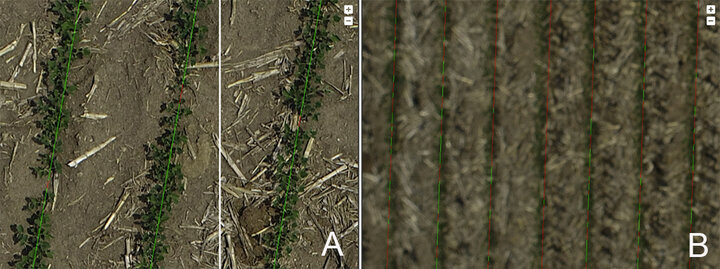
In Figure 6, the algorithm's stand count assessment is provided for 20- and 50-feet aboveground flight, with yellow representing plants and red indicating gaps. Although the specific workings of this company's algorithm are unclear, it appears to assess stand count by counting the gaps between plants (red lines), gauging the completeness of rows and estimating missing plants.
Figures 6a and 6b illustrate the impact of image quality on the algorithm's performance. At 20 feet aboveground (Figure 6a), the software easily identifies individual plants. However, at 50 feet aboveground (Figure 6b), lower pixel quality is evident, leading to a noticeable miscalculation in stand count, as indicated by red lines even when plants are present. This emphasizes the importance of considering altitude and image quality in optimizing drone-based stand count assessments for accurate results.

Final Remarks
This study evaluates the effectiveness of drone technology for soybean stand count assessments using the DJI Phantom 4 Pro V2 Drone and Sentera Field Agent software. Evaluation of three different drone configurations on stand count assessment was compared with field-measured stand count.
The recommended setting of 50 feet with -300% overlapping returned lower values than the field-measured stand count with about 32,000 plants/ac difference.
Flying the drone at 20 feet with -300% overlapping showed better results, differing only 5,000 plants/ac in relation to field-measured stand count.
Further studies are needed to investigate the system’s performance.
Acknowledgments and Contact Information
Thanks to the Nebraska Soybean Board for the financial support, and thanks to Bill Method and Ryan Loseke for the field, equipment, and time given to the project.
For more information, contact Luan Oliveira at University of Georgia at 229-386-3377.
