Background
Irrigation in the U.S. is primarily mechanized, with more than 57% of the irrigated land equipped with center pivot irrigation systems (USDA-NASS, 2019). Nebraska has 8.3 million irrigated acres, which account for 14.9% of the total irrigated acreage in the U.S. Nebraska uses approximately 90% of its water for irrigation, having over 80,000 center pivot irrigation systems.

While these mechanized systems are highly efficient in applying irrigation, they should be supplemented with scientific irrigation scheduling (SIS) methods to compute crop water requirements precisely for different parts of the field. If every field reduced seasonal irrigation application by one inch, this would have a significant positive impact on our water resources.
Unfortunately, the rate of adoption for SIS methods has been fairly low (USDA-NASS, 2019). For example, soil moisture probes are used in only 7-12% of fields, while traditional methods of irrigation scheduling such as plant and soil appearance remain very popular. Unfortunately, these methods leave farmers feeling uncertain about whether the crop has enough water, which leads to putting on extra irrigation for insurance purposes.
The main barriers to adoption of new technologies in irrigation include cost and ease of use. These scientific methods need to be cost-effective and feasible for farmers to adopt. Today, using soil water monitoring equipment provides the most effective method for farmers to make data-driven irrigation scheduling decisions to apply the minimal amount of water while achieving optimal yields. However, the costs in labor and equipment limit their use. So, research continues to focus on developing lower-cost methods to schedule irrigation that results in putting on just the right amount of water. Since producers do not have time to do detailed work with large amounts of data often generated using SIS methods, the automation of SIS methods would likely provide incentives to producers by saving their time and, simultaneously, reducing the irrigation applications and producing optimal crop yield.
Approach
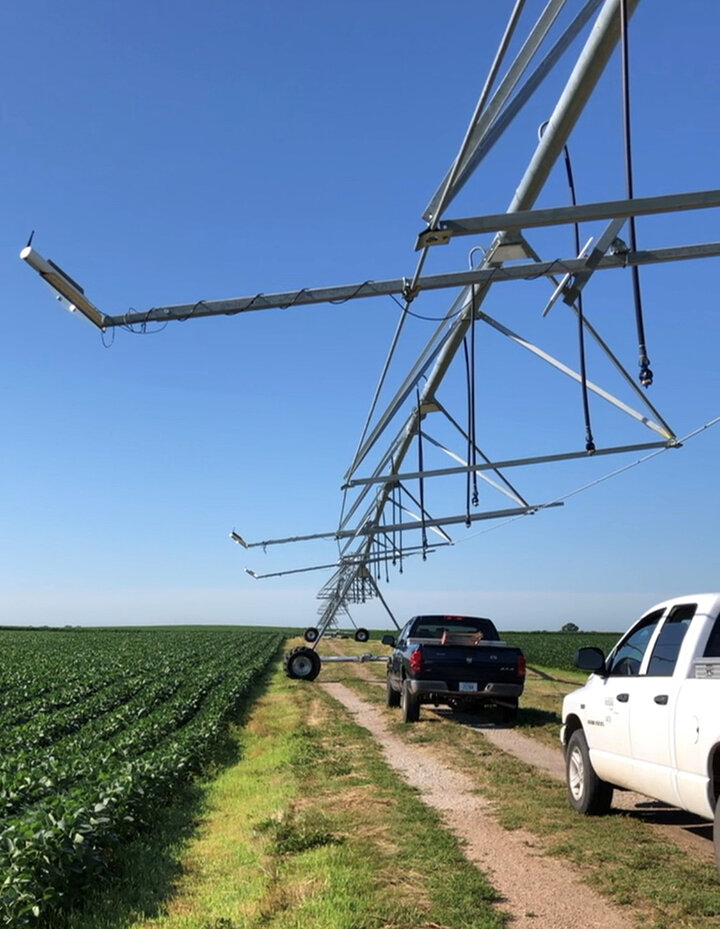
One approach to data collection is that the center pivot itself can be used as a platform to mount crop canopy sensors (Figure 1) which inform the SIS methods. As the pivot is moved around the field, the sensors can monitor the crop and collect essential data across the field. Also, high-speed center pivot systems are now available on the market, which are capable of moving around the field in about four hours (as compared to more than eight hours in most pivots). This high speed makes it possible for all data (throughout the field) to be collected during peak daylight hours (11 a.m.–4 p.m.), when the crop is most likely to experience stress. The pivot can be automated to run without water application for acquisition of data. This can eliminate the labor requirements and save time for producers. The SIS methods can be programmed to compute an irrigation recommendation based on the data collected. However, research is needed to test different types of sensors mounted on the pivot and their use for irrigation management with SIS methods.
BSE Associate Professor Derek Heeren, graduate student Sandeep Bhatti and graduate research assistant Eric Wilkening discuss their research project using thermal and multispectral center pivot sensors to gather crop data. Their findings could have positive impacts for farmers looking to optimize irrigation methods and maximize resources.In order to help advance this particular irrigation scheduling technology, we conducted a research study focused on irrigation management of corn and soybean in a 140-acre research field at the Eastern Nebraska Research, Extension and Education Center. The study included infrared thermometers (IRTs) and multispectral sensors mounted on the center pivot. The project utilized an irrigation management tool, the Irrigation Scheduling Supervisory Control and Data Acquisition (ISSCADA) system, developed by the USDA Agricultural Research Service (Bushland, Texas). This tool automates data collection, interprets the data collected by the pivot-mounted IRTs and outputs an irrigation recommendation.
The project, funded by the Irrigation Innovation Consortium, the Daugherty Water for Food Global Institute, and Valmont Industries, compared various sensor-based irrigation scheduling methods to a “common practice” treatment (determined using the hand-feel method for soil moisture). Each of these irrigation methods were applied at different irrigation levels: 0% (rainfed), 50% (deficit), 100% (full), and 150% (over-irrigated).
Findings
We found that the pivot-mounted sensors had high correlations and low mean errors when compared to the stationary sensors mounted on posts in the field. The pivot-mounted multispectral sensors were able to detect differences in crop development between rainfed and irrigated crop when the crops were approaching maturity.

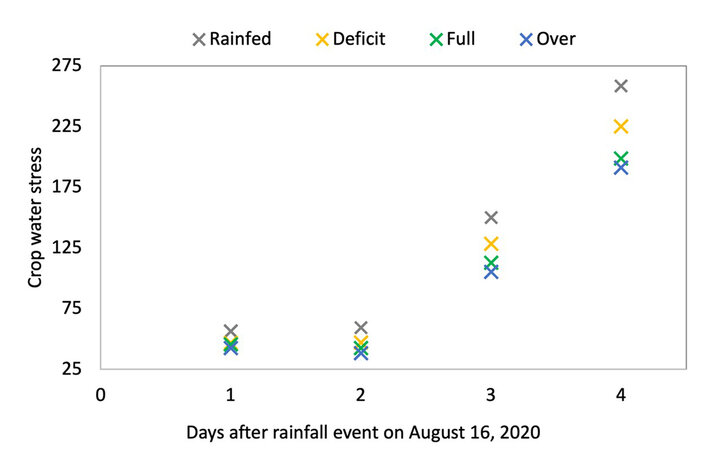
The crop water stress was found to be small soon after a rainfall/irrigation event and drastically increased three to four days after a wetting event. For example, the crop water stress data for corn in 2020 is shown in Figure 2 where the crop water stress was low for all irrigation levels but increased after two days from a wetting event. It was noted from the figure that the rainfed had the highest water stress while the fully irrigated levels had least stress on a specific day.
In addition, the IRTs in the full and over-irrigation levels detected crop water stress at multiple days (more than two days after a wetting event) but did not result in yield loss. At the full irrigation level, the common method prescribed the largest irrigation depth for three of four cases, with sensor-based methods prescribing reduced irrigation applications.
In 2020, the rainfed crop had significantly lower crop yield as compared with the irrigated treatments. The deficit irrigation resulted in 5% loss of maize yield as compared to full irrigation in 2020.
More research is needed to conclude whether thermal sensing alone is sufficient to manage irrigation. Additionally, more research needs to be conducted in different regions and climates to ensure these systems are optimized for different field and weather conditions. Development of weather-, location- and crop-specific thresholds (for thermal indices) would make the system more adaptable to new locations.
Conclusion
Looking forward, mounting sensors on the center pivot shows promise as an important component of automating irrigation. The sensors on the pivot used in this study were able to accurately detect crop water stress in different irrigation levels using the ISSCADA system. Mounting sensors on the pivot worked well to manage irrigation; additional types of sensors/imagers can be mounted to retrieve specific crop-related data.
The current cost of using sensors on the pivot is high when compared to the increase in profits from reduction of irrigation application and increase in crop yield. However, the use of pivot-mounted sensors for other aspects of crop production (e.g., nutrient management, weed/disease/pest identification) could also increase the value of the system. The barriers to adoption will likely diminish as sensors and software for pivot automation become easier to use.
A field can be managed with uniform irrigation by mounting two IRT sensors in the outer two spans of the pivot. Since most center pivots can vary the irrigation application across the field using either speed control or zone control, the SIS methods can be used to implement variable rate irrigation more effectively and on a greater number of systems. For management of variable rate irrigation, two pairs of sensors (four sensors) on the pivot would be helpful for sensing additional field area. The SIS methods reduced irrigation applications as compared with the common practice method, with potential benefits for water quality by reducing nitrate leaching.
More Information
Bhatti, S., Heeren, D. M., Shaughnessy, S. A. O., Evett, S. R., Maguire, M. S., Kashyap, S. P., & Neale, C. M. U. 2022. Comparison of stationary and mobile canopy sensing systems for maize and soybean in Nebraska, USA. Applied Engineering in Agriculture, 38(2), 331–342.
Bhatti, S. 2022. Thermal sensing for automated irrigation management of maize and soybean in Nebraska. Ph.D. Dissertation. University of Nebraska-Lincoln.
Brown, K. 2022. Pivoting to automation. Irrigation Today 6(3): 14-17. Available at: https://irrigationtoday.org/winter-2022-issue/.
Lo, T., D. R. Rudnick, Y. Ge, D. M. Heeren, S. Irmak, J. B. Barker, X. Qiao, T. M. Shaver. 2018. Ground-based thermal sensing of field crops and its relevance to irrigation management. NebGuide G2301, Nebraska Extension.
