Cover crops are recognized as a tool for nutrient management and soil erosion prevention. Cover crops may also suppress weeds through direct competition for space, nutrients and light, but the level of suppression is related to the amount of biomass produced. With herbicide-resistant weed populations increasing and herbicide prices rising in 2022, cover crops may be an effective integrated weed management tool that complements herbicide programs.
Over time, weed suppression from cover cropping may impact the number of weed seeds and species stored in the soil. The soil seedbank is useful for insights on weed populations and their composition, which provide clues as to what may be occurring with aboveground weeds, but this effect has not been well-studied in field settings in Nebraska.
Field Experiments and Measurements
To understand cover crop impacts on the weed seedbank and weed growth, we sampled soils in early spring to germinate seedbanks and took periodic measurements of weed density (quantity of weeds emerged) and weed biomass (size of weeds) during the growing season.
Trials were conducted in 2021 using small research plots and field-scale on-farm experiments at six sites located across eastern and central Nebraska. Four locations were on-farm sites collaborating with the USDA-NRCS Soil Health Initiative and Nebraska On-Farm Research Network located in Colfax, Greeley, Howard, and Merrick counties. The research plots were at the Eastern Nebraska Research and Extension Center (ENREC) and the South-Central Agriculture Laboratory (SCAL).
Field history for each of the six sites differed prior to our field sampling efforts. For example, on-farm locations had multi-species cover crop mixes (five to 10 species such as buckwheat, canola and turnips) planted each year since 2017 or 2018, and research stations had cover crops of cereal rye (Secale cereale L.) or hairy vetch (Vicia villosa Roth) planted each year since 2014. All cover crop plots were compared to check plots without cover crops.
In 2020, the growing season prior to our data collection, on-farm sites grew a small grain (Secale cereale L. or Triticum aestivum L.) or field pea (Pisum sativum L.) cash crop, and research stations grew soybean (Glycine max L.). Five locations grew corn (Zea mays L.) and one grew soybean during the experiment in 2021. All sites were no-till except for the Merrick County site, which was strip-tilled, and all sites utilized pre-emergence and post-emergence herbicides. Five of the six sites used glyphosate in their tank mixes for pre-emergence herbicides that terminated the cover crops in mid to late April, and cover crops were not incorporated into the soil.
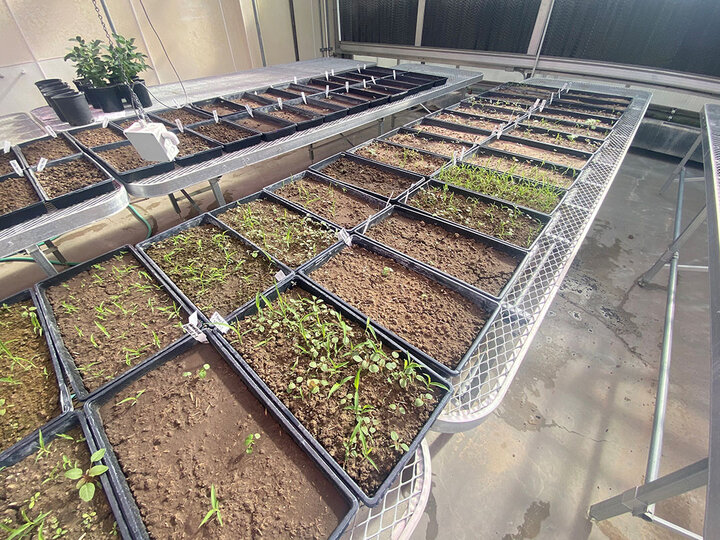
Before cover crop termination in early April, the soil seedbank was sampled at 20 random locations in each plot and mixed together to form one composite sample per plot. Soil samples from the field were brought to the greenhouse and sieved to break up soil clods, then laid into trays where they were watered and monitored daily. All weed seedlings that emerged in the greenhouse between April and November were identified by species, counted, then discarded (Figure 1). To stimulate new germination flushes, trays were dried for five days and resieved before being watered again, which occurred in July and September, until no more germination occurred. Seedlings counts were converted into estimations of weed seeds per acre.
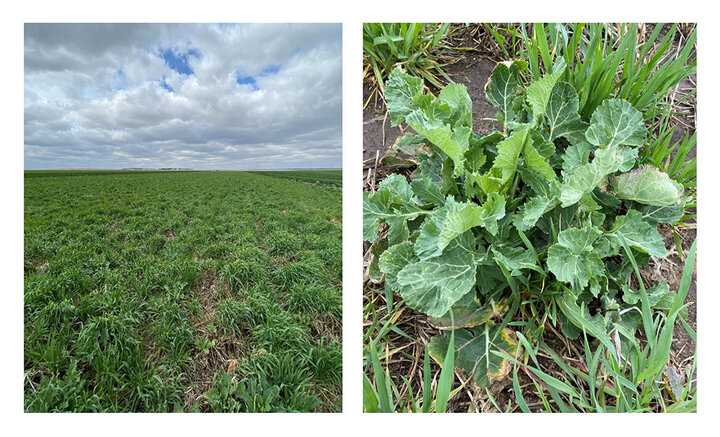
In mid-April, we sampled cover crop biomass in the field before termination in each plot at a rate of one sample per acre (on-farm) or twice per plot (research stations) (Figure 2). We took weed density and weed biomass measurements (indicators of weed emergence and growth) during the early growing season (“early”) after cash crop emergence but before post-emergence herbicides and before crop canopy closure (“late”) three to four weeks after post-emergence herbicides. These measurements were taken from three randomized locations in each plot.
Results
Weed Seedbank
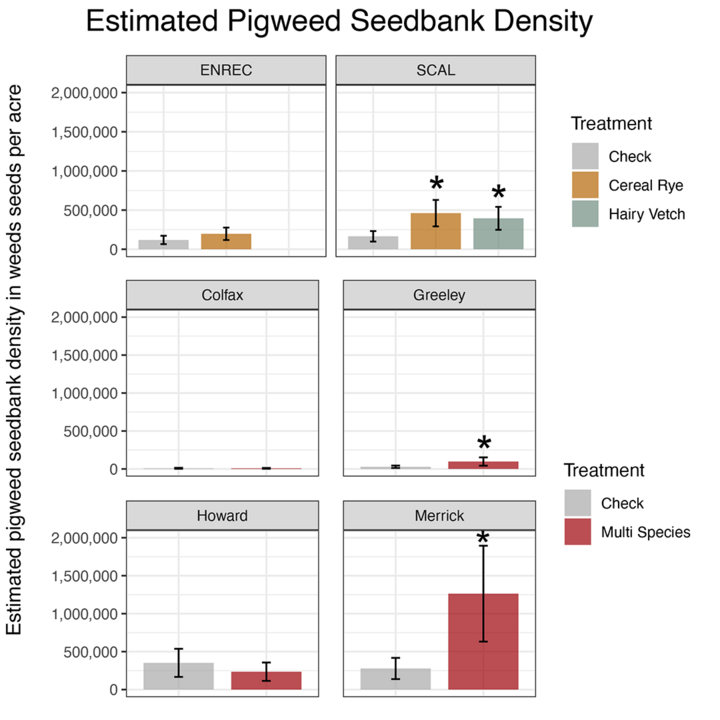
No differences between cover crop and check plots were observed for the estimated total number of weed seeds in the seedbank (weed seeds per acre), but the quantity of pigweed seeds (Amaranthus spp.) significantly increased in the cover crop plots compared to the check plots at three sites (Figure 3). For example, pigweed seedbank density increased from approximately 229,000 seeds per acre in the check to 1,044,000 seeds per acre in the cover crop treatment at the Merrick County site.
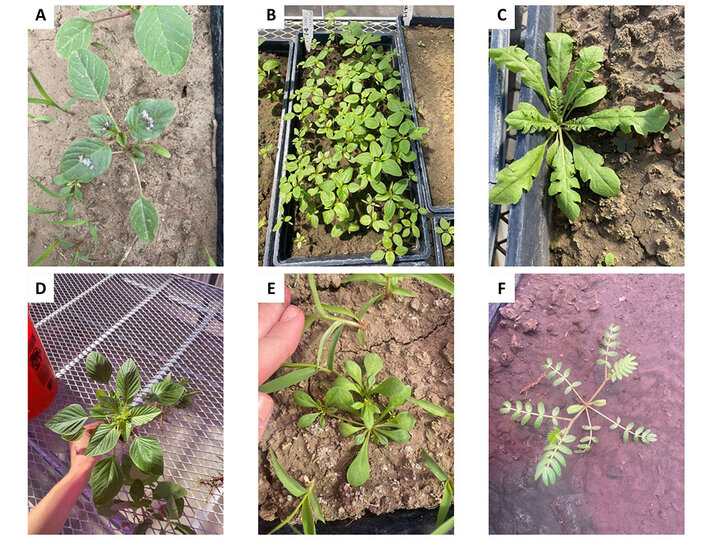
In addition, the number of weed species (species richness) in the cover crop treatments was greater at all sites than the check. Palmer amaranth, green foxtail and common lambsquarters were the most common species found across all sites (Figure 4).
Cover Crop Biomass
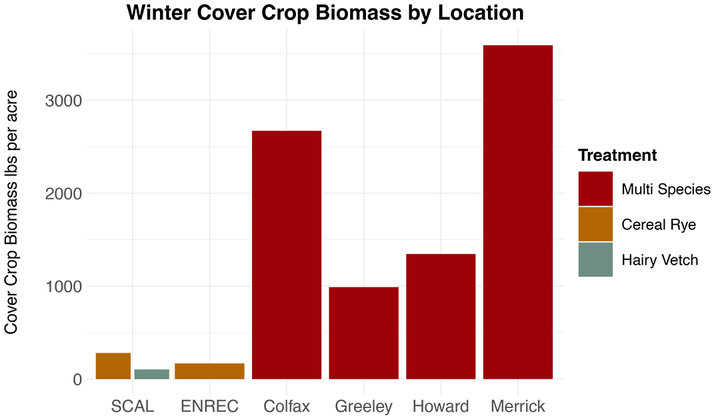
Cover crop biomass averaged 103-3,590 lbs per acre, depending on the site (Figure 5). Multi-species cover crops at the on-farm sites accumulated more biomass than monocultures of hairy vetch or cereal rye at SCAL and ENREC, partly because of earlier fall planting following the small grain harvest in 2020.
Weed Growth
Weeds were categorized by pigweeds, grasses and other broadleaves, and totals were the sum of the three categories. In general, there were small amounts of weed growth in all plots and most weeds sampled for biomass were less than one inch tall.
Total weed density ranged from 7,000 to 2,900,000 weeds per acre and was significantly reduced in the cover crop treatment at the Greeley County site during both sample periods and at ENREC during the late sample period.
Weed biomass was low across all sites and ranged from 0.08 to 55 lbs per acre. Cover crops significantly reduced weed biomass at the Howard County site for the early sample period and both of the sample periods for the Greeley County site. Despite the increases in pigweeds in the seedbanks, no differences in emerged pigweed density or biomass were observed in the cover crop treatments when compared with the check treatments.
Key Takeaways
- Increases in pigweed seeds in cover crop treatment seedbanks could be a result of cover crop suppression of weed emergence, indicating more seeds remained ungerminated in the soil seedbank for the cover crop treatment compared with the check.
- Large pigweed seedbank densities were not expressed with aboveground weed density in the cover crop treatments, further pointing to the possibility of pigweed seed suppression.
- We did not find consistent weed control benefits during the growing season in these experiments, which may be attributed to the variability in the amount of cover crop biomass achieved or small amounts of weed growth throughout the plots. Approximately 4,400 lbs of cover crop biomass per acre has been shown to reduce weed biomass by 75% (Nichols et al., 2020), but no sites in our study had this much biomass. Trying to maximize cover crop growth potential by planting cover crops earlier in the fall and terminating later in the spring is recommended, particularly if weed suppression is an important goal.
Acknowledgements: The authors would like to thank the growers in collaboration with the Nebraska OFRN and NRCS Soil Health Initiative who provided on-farm research opportunities for this project, as well as ENREC and SCAL staff for their support on the experiments.
Funding: Funding for this project was provided by the Natural Resources Conservation Service (USDA-NRCS) under agreement no. 68-6526-17-005.
References
Nichols, V., Martinez-Feria, R., Weisberger, D., Carlson, S., Basso, B., & Basche, A. (2020). Cover crops and weed suppression in the U.S. Midwest: A meta-analysis and modeling study. Agricultural & Environmental Letters, June, 1–7. https://doi.org/10.1002/ael2.20022
