Key Points:
- System economics need to include value of grazing, costs of grazing (water, fence, labor, livestock care), cover crop costs, crop costs and value.
- This article provides an example of how to look at economics for a system’s approach. Each location may vary and it’s important to look at individual site economics!
- The ungrazed wheat stubble treatment was most economical at the location where a cool-season cover crop was planted and water was hauled for livestock grazing.
- The grazed cover crop treatment was the most economical at the location where a warm-season cover crop was planted and water didn’t have to be hauled.
Introduction:
In non-irrigated systems, adding cover crops into the rotation can decrease crop yields if precipitation is limited; however, the use of cover crops for forage may offset costs while retaining soil benefits. This on-farm research study was designed with a system’s perspective incorporating crops, cattle and cover crops in a non-irrigated setting while including the economics of the entire system. The producers’ goals were to increase soil organic matter and determine yield and economics of the system. The crop rotation is Wheat (with cover crop planted into stubble after harvest), Corn, Soybean. Cattle graze the cover crop in the winter and also graze the corn residue.
This study evaluated three treatments: grazed cover crop (or corn residue, depending on the year of crop rotation), non-grazed cover crop and non-grazed wheat stubble. Beginning and three-year follow-up soil property, nutrient and health data were taken. Additional data include yield and soil moisture of each crop, cover crop biomass, grazing days and economics.
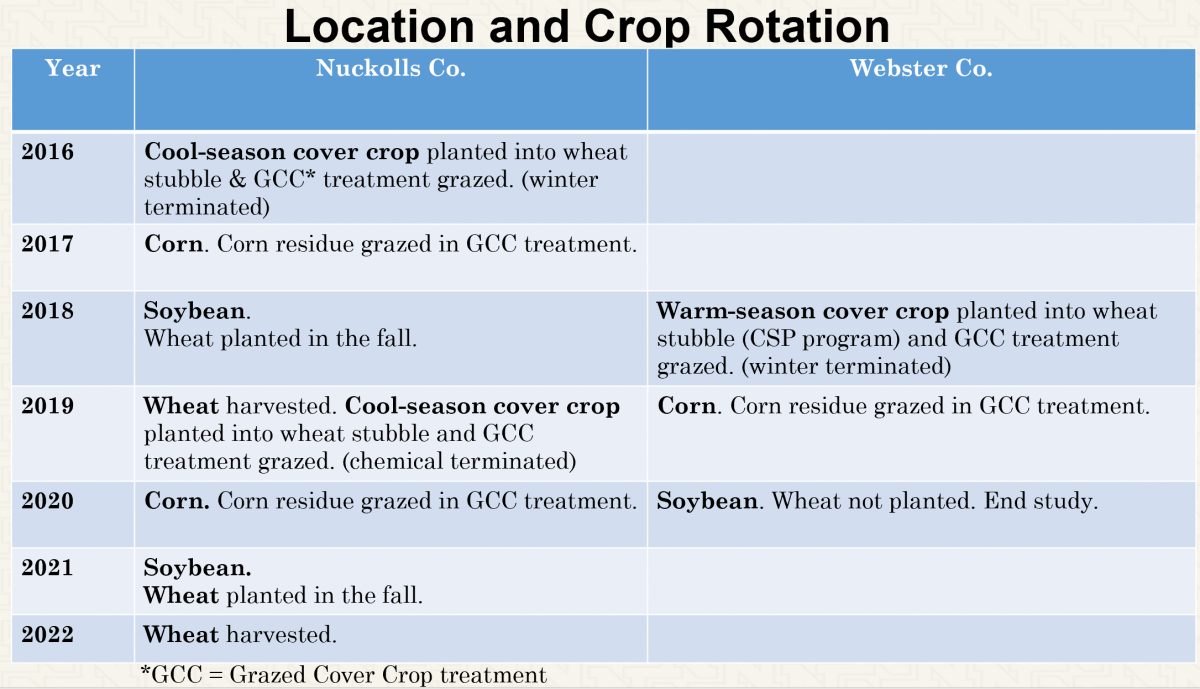
Because yearly weather impacts crop growth and yield, two locations were established with the crop rotation in off-set years (Figure 1). A cool-season cover crop was planted after wheat harvest at the Nuckolls County location while a warm-season one was planted after wheat harvest at Webster County.
Location Summaries:
Nuckolls: The Nuckolls County study began after wheat harvest in 2016. The site consists of Hastings silt loam soils of 0-1% slope. A cool-season cover crop (winter peas, spring triticale, oats, collards and purple top turnip) was planted on Aug. 16, 2016. Cover crop biomass measured on Oct. 19, 2016, was 3,401 lb/ac and consisted mainly of grass and turnip. In the grazed treatment, 28 (1,100 lb) first-calf heifers grazed 9.6 acres for 22 days in November 2016, resulting in the cover crop carrying 2.4 animal unit months (AUM)/ac. Post-grazing 2,177 lb/ac of biomass were still present.
On Sept. 3, 2019, a cool-season cover crop (winter peas, winter triticale, black oats, collards, turnip) was planted. Cattle grazed the cover crop and only 8.66 AUM were achieved due to the wet fall, late planting and minimal growth. Cover crop was 8 inches at time of termination in March 20, 2020.
Three-year analysis showed no difference in soil organic matter, nutrients, physical properties (bulk density and compaction) nor soil health via Haney test amongst treatments. There was greater total microbial and fungal biomass (via phospholipid fatty acid PLFA test) in the grazed cover crop treatment (indicators of improved soil health). Our hypothesis is the increased microbes in the grazing treatment aided in breaking down residue, which potentially led to more soil evaporative losses in the dry year of 2018. This may help explain the yield loss in that treatment and in the future, cattle will be removed earlier to account for the microbes also feeding on residue.
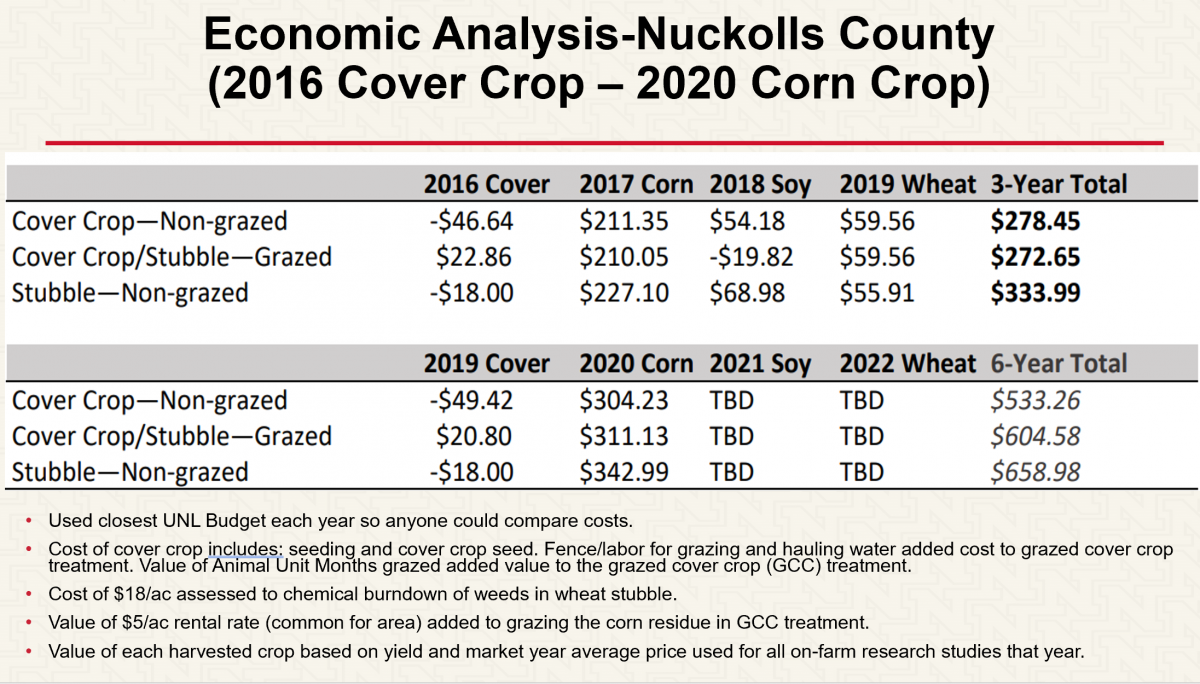
In four years of studies, there were no yield differences amongst treatments for corn in 2017 or wheat in 2019. The soybean planted into the grazed cover crop treatment yielded 12 bu/ac less than the non-grazed treatments in 2018. The corn planted into the ungrazed wheat stubble in 2020 also yielded significantly more than the cover crop treatments in a dry year (Table 1). The ungrazed wheat stubble is the most economical treatment at this location (Figure 3). Potential reasons include: cost of hauling water for grazing, numerically higher yields in the ungrazed wheat stubble, variable biomass in cool-season cover, and yield losses to the crops in the grazed cover crop (2018) or cover crop treatments (2020) in dry years.
Webster: The Webster County location began in 2018 with a warm-season cover crop (cowpea, BMR sorghum sudan, pearl millet, radish and turnip). This site also consists of Hastings silt loam soils of 0-1% slope. Total average pounds of grass and brassica biomass was 8,405 lb/ac measured upon termination by frost (November 2018) and sorghum sudan was 4-5 inches tall upon termination. The grazed area contained 52.3 acres. Oct. 21, 2018, 35 head of first-calf heifers weighing 1,100 lbs grazed for 91 days.
In two years of study, there were no yield differences amongst treatments (Table 1). Follow-up soil analysis has not yet been conducted. The site will no longer continue in this study. Over 4 tons of biomass allowing for 91 grazing days, not hauling water and no successive crop yield differences all led to the grazed cover crop being the most economical treatment at this location.
Soil Moisture Impacts in Non-Irrigated Locations:
WATERMARK™ soil moisture sensors were installed (1-4 foot depths) to determine treatment impacts for each growing season and cover crop. Prior to planting corn in Nuckolls County in 2017, the cover crop treatments were around 35% depletion (the typical trigger point for irrigation on these soil types), whereas the wheat stubble treatments remained near field capacity (full soil moisture profile). In May 2017, 8 inches of rain recharged the soil profile and all treatments had a full soil moisture profile at the beginning of June. Therefore, the cover crop treatments did not result in lower beginning moisture, which could limit yield potential. The grazed treatments began to show greater soil moisture depletion than the ungrazed treatments as time progressed but there were no yield differences.
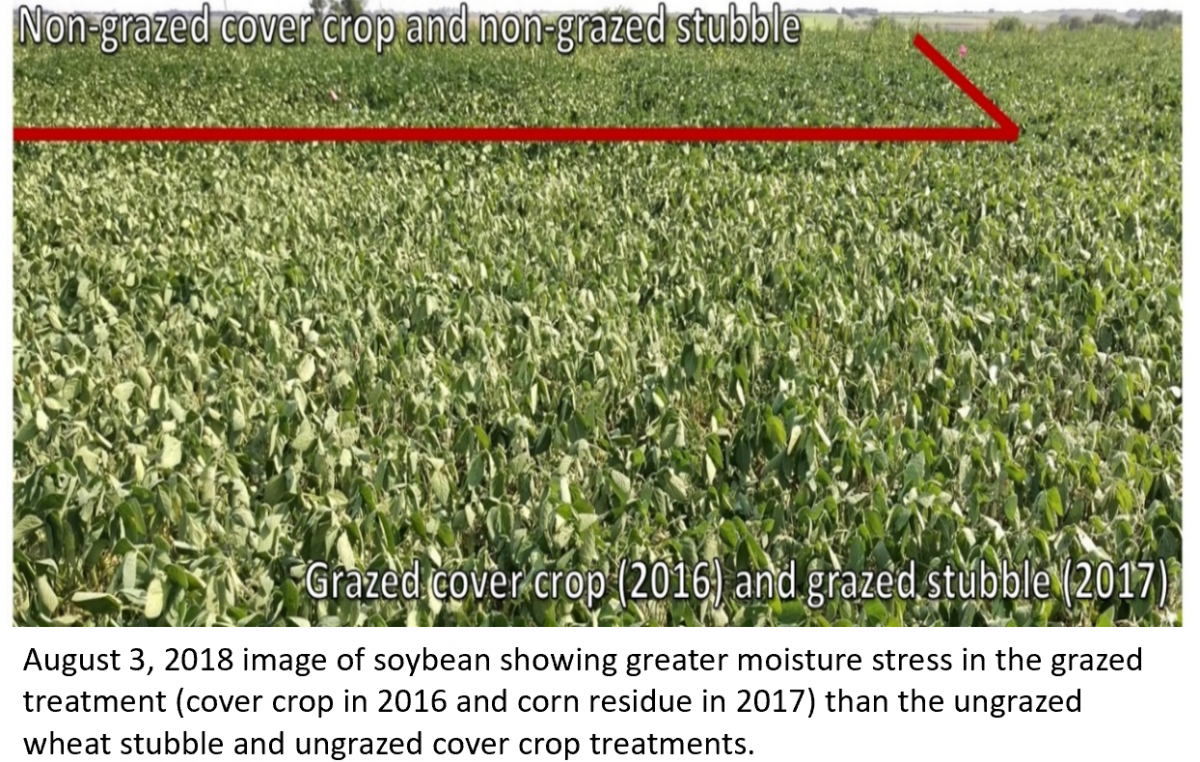
2018 was a dry season in this portion of the state. The grazed treatment showed less soil moisture compared to the non-grazed treatments the entire growing season at both locations. By August, the soybeans in the grazed treatment (Nuckolls) showed greater moisture stress than the non-grazed treatments (Figure 2) and there was yield loss in that treatment.
There were no soil moisture impacts in 2019 due to the wet growing season. Corn (Nuckolls) and soybean (Webster) were planted into full soil moisture profile in all treatments in 2020. By the end of August, all treatments (in both locations) reached 50% depletion with the ungrazed wheat stubble treatment reaching 50% depletion later than the other treatments. There were no soybean yield differences amongst treatments (Nuckolls); however, the corn yielded significantly higher in the ungrazed wheat stubble treatment compared to the cover crop treatments in 2020. Yields for both locations were very good in spite of the dry soil moisture conditions (Table 1).
| Year and Location | Crop | Non-grazed wheat stubble treatment yield† | Non-grazed cover crop treatment yield | Grazed cover crop treatment yield |
|---|---|---|---|---|
| 2017 Nuckolls | Corn | 218A | 213A | 211A |
| 2018 Nuckolls | Soybean | 52A | 50A | 40B |
| 2019 Nuckolls | Wheat | 83A | 84A | 84A |
| 2020 Nuckolls | Corn | 227A | 215B | 216B |
| 2019 Webster | Corn | 187A | 189A | 191A |
| 2020 Webster | Soybean | 61A | 61A | 63A |
*Values with the same letter are not significantly different at a 90% confidence level.
†Bushels per acre corrected to 15.5% moisture for corn, 13% moisture for soybean, 13% moisture for wheat.
Take Home Points:
Thus far, the ungrazed wheat stubble treatment was the most economical at the Nuckolls County location when a cool-season cover crop was used and water had to be hauled for grazing. The grazed cover crop treatment was the most economical at the Webster County location. It is important to add all the components when looking at economics (next section). The differing results at the two locations showed the influence of cover crop biomass and importance of including value of grazing; fencing/water/labor costs for livestock; cover crop costs; and successive crop yields in system economics. It’s easy to make assumptions that a certain practice is profitable! The Nuckolls County location will hopefully continue another six years switching the cool-season cover crop to a warm season one to compare economics on the same field. We’re curious if the warm season cover will increase biomass and grazing days enough to outweigh the water hauling costs and show a benefit to the grazed cover crop treatment, or if the ungrazed wheat stubble will remain the most economical for this field location.
For the future of cover crop economics, it could be helpful to determine a consistent way for assessing a dollar value for potential benefits such as aiding in weed and erosion control, nutrient uptake, etc. This may aid conversations with landlords and lenders for those desirous to try them. Without livestock value, currently on paper, there’s really only costs.
Nuckolls Multi-Year Economic Analysis (2016 Cover Crop to 2020 Corn Crop)
For these analyses, the closest UNL budget for each year was used to allow any producer to compare the crop cost of production.
2016 Cover Crop: Cost for spraying wheat stubble was $18/ac. Costs for the non-grazed cover crop treatments were $46.64/ac ($28.64/ac for seed and $18/ac for drilling). Costs for grazed cover crop treatments were $61.94/ac ($46.64/ac for the cover crop seed and planting, $5/ac for fencing, and $10.30/ac for water). Water cost was calculated assuming hauling water (1,000 gal) 15 miles every two days at $2 per loaded mile and $6 per $1,000 gal. Costs for the grazed cover crop treatments equaled $30.97/AUM (animal unit months). Value of the forage is estimated to be $84.80/ac (based on rental rates of $53/pair/month [1.25 AUMs] or $42.40 AUM).
2017 Corn: The economic analysis had no input differences for any of the treatments for corn production. UNL Corn Budget 21 (EC872, 2017 Nebraska Crop Budgets, revised November 2016) was the closest that fit this operation, so a total cost/ac of $459.60/ac and a market year average price of $3.15/bu was used. In the previously established grazed cover crop treatment, cattle grazed on the corn stalks. A $5/ac cornstalk rental rate value was assessed to this 9.6-acre area. This rate assumes water, fencing and the care of the animals.
2018 Soybean: The inputs were the same for the soybeans planted into all the previous treatments. UNL Budget 56 (EC872, 2018 Nebraska Crop Budgets, revised November 2017) was used, which stated a $315.82/ac total cost. A market year average price of $7.40/bu was used.
2019 Wheat: The inputs were the same for the wheat planted into all the previous treatments. UNL Budget 70 (EC872, 2019 Nebraska Crop Budgets, revised November 2018) was used which stated a $247.04/ac total cost. A market year average price of $3.65/bu was used.
2019 Cover Crop: Cost for spraying the wheat stubble was $18 ($9/ac application and $9/ac herbicide cost). Costs for the non-grazed cover crop treatments were $49.42/ac ($31.42/ac for seed and $18/ac for drilling). Costs for grazed cover crop treatments were $64.00/ac ($49.42/ac for the cover crop seed and planting, $5/ac for fencing, and $9.58/ac for water). Water cost was calculated based on hauling water (5.75 water trips at $16/trip which included cost of water). Costs for the grazed cover crop treatments equaled $54.78/AUM (49.42*9.6=474.43/8.66AUM from what was grazed=54.78). Value of the forage is estimated to be $84.80/ac (based on rental rates of $53/pair/month (1.25 AUMs) or $42.40 AUM). Forage production was limited in fall of 2019 compared to 2016 due to wet summer that delayed wheat harvest which delayed cover crop planting. Cool fall led to less growth. Only 8.66 AUM was achieved with the 2019 cover crop compared to 19.03 AUM with the 2016 cover crop.
2020 Corn: The economic analysis had no input differences for any of the treatments for corn production. UNL Corn Budget 23 (EC872, 2020 Nebraska Crop Budgets, revised November 2019) was the closest that fit this operation, so a total cost/ac of $452.10 and a market year average price of $3.51 was used. In the previously established grazed cover crop treatment, cattle grazed on the corn stalks. A $5/ac cornstalk rental rate value was assessed to this 9.6-acre area. This rate assumes water, fencing and the care of the animals.
Webster County Multi-Year Economic Analysis (2018 Cover Crop to 2020 Soybean Crop)
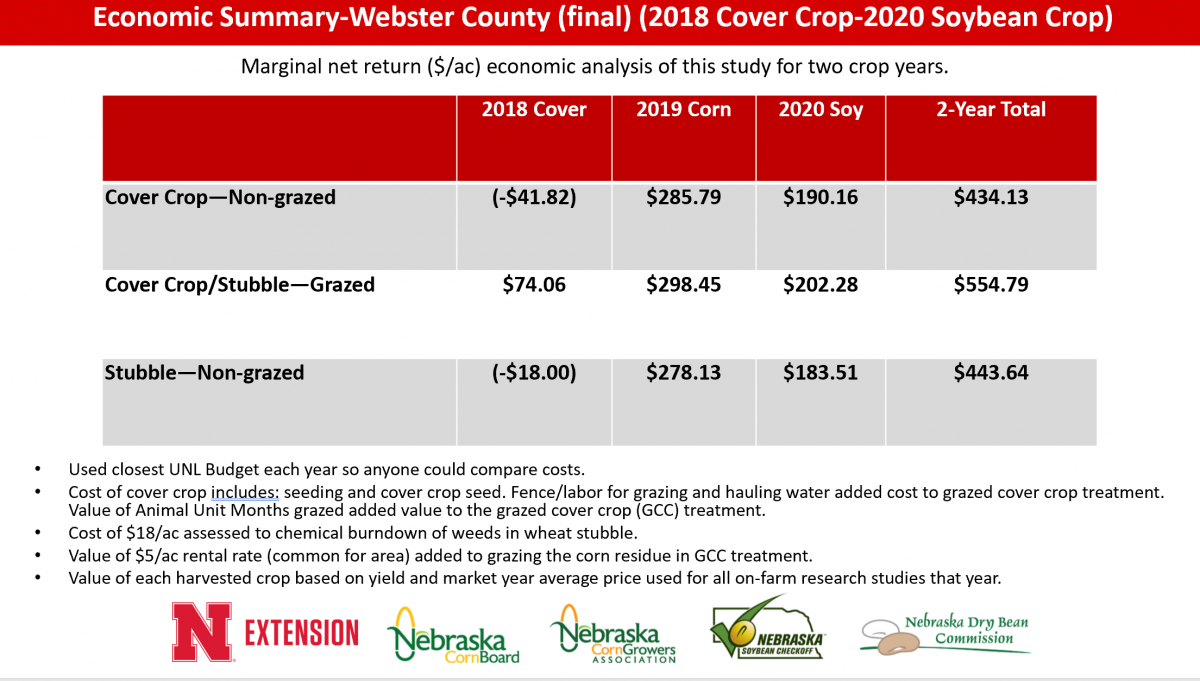
2018 Cover Crop: Costs to spray the wheat stubble for weed control were $18/ac. Costs for the non-grazed cover crop treatments were $41.82/ac for cover crop seed and drilling. Costs for the grazed cover crop treatments were $47.74 ($41.82/ac for cover crop seed and drilling, $5/ac for fencing, and $0.92/ac water). Grazing benefit is $6370 (using a value of $2.00/head/day) for the 52.3 acres grazed. The resulting net benefit is $74.06/acre.
2019 Corn: The economic analysis had no input differences for any of the treatments for corn production. UNL Corn Budget 23 (EC872, 2019 Nebraska Crop Budgets, revised November 2018) was the closest that fit this operation, so a total cost/ac of $438.08/ac and a market year average price of $3.83/bu was used. In the previously established grazed cover crop treatment, cattle grazed on the corn stalks. A $5/ac cornstalk rental rate value was assessed to this 52.3-acre area. This rate assumes water, fencing and the care of the animals.
2020 Soybean: The economic analysis had no input differences for any of the treatments for soybean production. UNL Soybean Budget 58 (EC872, 2020 Nebraska Crop Budgets, revised November 2019) was used which states a $392.90/ac total cost. A market year average price of $9.50 was used.
The authors would also like to acknowledge the following for their help and partnership with this effort: Herz family, Gary Lesoing, Dr. Charlie Wortmann, Dr. Suat Irmak, Brad Schick, Michael Sindelar, several graduate students, Green Cover Seeds, Ward Labs.
Sponsorship of soil test analysis and some mileage was provided by the Nebraska Environmental Trust.
