

Soil Temperature Considerations
- Soil moisture can reduce the soil temperature warming and cooling rate.
- Dry, bare soil can vary at least 10-15°F at a depth of 4 inches during one day (more variation closer to surface). (See Figure 2)
- If you're taking your own soil temperature measurements, do it at same time every day for accurate comparison. (The soil will be coldest at mid-morning).
- Snow cover will reduce cold temperature penetration in the soil.
Soil temperature can vary significantly with the season, soil depth, soil moisture, residue/snow cover, soil type, etc. Soil temperature monitoring may be useful for estimating potential pest pressure, frost depth, planting conditions, moisture infiltration, and soil biological activity, among other things; however, soil temperature is not a standard variable collected at most weather stations.
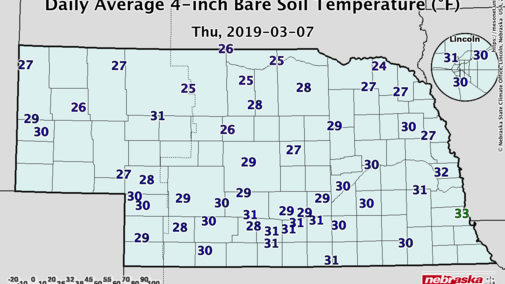
Current daily average soil temperatures are in the upper 20s and lower 30s for most of Nebraska, at the 4-inch depth. Even though air temperatures set record lows this week, the abundant snowpack and soil moisture (for most), kept soil temperatures warmer than one might expect. This may benefit over-wintering crops, but also pest survival.
Soil Temperature Resources
A commonly used soil temperature source is the CropWatch Soil Temperature Update with data from the Nebraska Mesonet. This provides a daily average and a seven-day average soil temperature at a depth of 4-inches through statewide maps and a table with each of the 67 Mesonet sites. The table provides an average, high, and low soil temperature for the previous seven days, as well as the most recent midnight reading. All of these readings are provided for a bare soil surface, but a few sites also provide comparisons to a grass covered surface.
For a mobile-based alternative, the university’s AgriTools mobile app will provide interpolated 4-inch soil temperature based on your GPS location using the data from the Nebraska Mesonet. (Available for Apple and android.)
Every Monday and Thursday the National Weather Service provides a map showing the depth of frost penetration, as well as the depth of frost thawed, in order to give you a visual of the frozen layer (not temperature) of the soil. Frost depth is measured by placing a small tube of water in a tube buried in the ground. The water tube is removed every few days to measure the depth of frost, or lack thereof.
Another source of soil temperature for varying depths is the NRCS SCAN (Soil Climate Analysis Network), which has a few scattered stations in the region. This network provides soil temperature and soil moisture, among other variables, at multiple depths in the soil.
Seasonal and historical soil temperature data can be found by obtaining an account at the High Plains Regional Climate Center or on the NRCS SCAN website.
Many other options and sources are available for soil temperature data. These are only a few of the publicly available data.
