Agricultural producers face challenging financial circumstances on their cropland in 2020. While the upcoming production year provides a potentially better outlook, challenges remain for profitability and the health of the operation. This article covers changes in farm real estate markets, updates on Nebraska crop budgets, and resources for addressing financial stress and health.
Nebraska Farm Real Estate
Annually land industry experts participate in the Nebraska Farm Real Estate Market Survey and Report conducted by the University of Nebraska-Lincoln. Concern about trade with the United States and other nations was reported as the most negative economic force potentially impacting land values and cash rental rates across the state.
Farmland Values
>
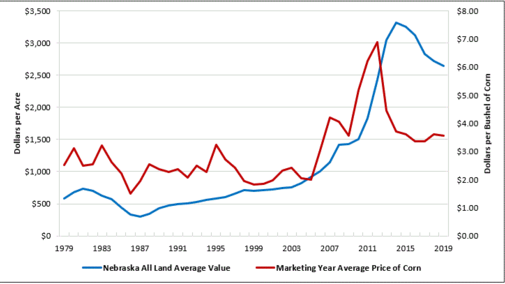
Nebraska farm real estate set the highest nominal (non-inflation adjusted) market value for the all-land average in 2014 at $3,315 per acre. Two years prior to the market high the price of corn peaked at $6.89 in 2012 during the 2012 record-setting drought (Figure 1).
- The prolonged downturn in commodity prices has survey members and stakeholders concerned about the financial circumstance of many agricultural producers across the state. As a result, since the peak in the all-land market value, the price of land has declined $670 per acre.
- The effects of trade have been felt throughout Nebraska on commodity prices and negative basis-levels. Long-term effect of trade on major commodities produced across Nebraska may carry forward into future farm real estate values across the state.
- Another force weighing down on farm real estate markets, according to survey participants, was current and future property tax policies. Landowners look to property tax discussions in state-level public policy for potential relief in real estate taxes.
Cropland Rental Rates
Cash rental rates on average trended down across Nebraska in 2019. Table 1 summarizes average cash rental rates for cropland in 2019, percent changes from the prior year, and the high- and low-third quality grade averages.
Table 1. Reported Cash Rental Rates for Cropland in Nebraska: 2019 Averages (Source: Nebraska Farm Real Estate Market Survey 2018-2019)
| Type of Land | Agricultural Statistics District | |||||||
| Northwest | North | Northeast | Central | East | Southwest | South | Southeast | |
| - - - - - - - - - - - - - - - - - - - - - - - Dollars Per Acre - - - - - - - - - - - - - - - - - - - - - - - | ||||||||
| Dryland Cropland | ||||||||
| Average..................... | 27 | 50 | 205 | 84 | 200 | 38 | 73 | 155 |
| % Change.................. | -4 | -6 | -2 | -5 | 5 | -7 | -4 | -3 |
| High Third Quality….… | 40 | 74 | 245 | 110 | 230 | 55 | 105 | 185 |
| Low Third Quality……. | 21 | 36 | 170 | 67 | 160 | 31 | 47 | 125 |
| Gravity Irrigated Cropland | ||||||||
| Average..................... | 110 | 165 | 255 | 195 | 245 | 155 | 190 | 220 |
|
% Change.................. |
-4 | -3 | 2 | -5 | -4 | -6 | -5 | -2 |
| High Third Quality….… | 135 | 190 | 285 | 245 | 285 | 195 | 230 | 260 |
| Low Third Quality….… | 88 | 115 | 215 | 160 | 210 | 120 | 155 | 185 |
| Center Pivot Irrigated Cropland* | ||||||||
| Average..................... | 145 | 185 | 280 | 215 | 285 | 175 | 205 | 250 |
| % Change.................. | -3 | -8 | -3 | -2 | 2 | -8 | -5 | -4 |
| High Third Quality….… | 180 | 225 | 325 | 260 | 325 | 220 | 250 | 300 |
| Low Third Quality……. | 110 | 140 | 240 | 175 | 240 | 150 | 185 | 205 |
| *Cash rents on center pivot irrigated cropland assumes landowners own the total irrigation system. | ||||||||
- Rental rates for dryland and irrigated cropland across Nebraska trended down across the majority of Nebraska. These declines ranged from about 2 to 8 percent with the exception of several small increases in dryland center pivot-irrigated cropland in the east and gravity irrigated cropland in the northeast.
- Productivity of the cropland, including soil types, degree of slope, expected rainfall, and location, all influence the competitiveness of rent paid in an area, according to panel members. These differences by district provide the range and average paid-in cash rent from the low third to high third quality.
- The rate of decline for the high third and low third quality of cash rent for dryland and irrigated cropland across the different types of land stayed fairly consistent for the eight districts.
Biennially, the USDA National Agricultural Statistics Service (NASS) conducts a farm-level cash rental rate survey in odd-numbered years. Recent findings from the 2019 biennial cash rental rate survey (go.unl.edu/nass) indicates similar trends and patterns found by the annual University of Nebraska-Lincoln Nebraska Farm Real Estate Market Survey and Report.
The outlook on rental rates in 2020 may also be lower due to tight margins in crop budgets with depressed commodity prices. Producers negotiating cash rents need to focus on relaying commodity market fundamentals and production expenses associated with crop production to arrive at an equitable rental rate in 2020.
2020 Crop Budgets
The Nebraska Crop Budgets are prepared annually with adjustments based on changes in cropping practice norms across the state. The budgets are prepared to assist farm and ranch operators in planning for the upcoming growing season. For 2020 several budget factors were updated, including: inputs used in some budgets, material costs, yield adjustments, and general variable expenses.
With challenges occurring more and more with resistant weeds in some areas of the state, four new budgets were added: two pivot-irrigated corn budgets and two irrigated soybean budgets that use different herbicides. Overall, 15 additional herbicides were added to the material list in the budgets.
Other changes to note in the 2020 crop budgets include:
- The hourly labor rate was raised from $20 to $25. Labor charges are calculated in the field operation costs of the budgets.
- Yields for many of the budgets were adjusted upward to reflect the general notion that with improved technology, yields have been increasing over time. Increased yields drive the cost per unit down slightly.
- Many of the machinery and power unit list prices were adjusted higher, adding to repairs and ownership costs of field operations.
Even with some general, machinery, and input cost increases, cash and total costs per unit from 2019 to 2020 for most budgets, didn’t show significant changes. Budgets using the statewide dryland valuation including data from 2019 and 2020 reflect a cash cost for dryland corn of $2.67 per bushel and a total economic cost of $3.83 per bushel at the 121-bushel yield average for both budget years. For dryland soybeans, using a 44-bushel yield average, the cash cost average was $5.08 per bushel and the total economic cost per bushel was $8.01.
Averaging results from the 2019 and 2020 dryland wheat budgets, using Panhandle and southwest Nebraska land values, reflects a $3.19 cash cost per bushel and a $5.03 total economic cost per bushel using a 64-bushel yield.
The average cash corn cost from the 2019 and 2020 Nebraska crop budgets that use the statewide land value for irrigated ground, is $2.27 per bushel with a total economic cost of $3.23 per bushel, at a 250-bushel-per-acre yield average for both years. Using the same statewide land value for irrigated land, the average of 2019 and 2020 irrigated soybean cash costs per bushel is $4.79 and $8.01 per bushel for total economic costs at a 70-bushel average yield.
The Nebraska crop budgets provide guidance for producers to understand and calculate their cost of production each year. The cost of production is useful in establishing marketing plans, projecting net farm revenue, and making overall production and risk management decisions.
Financial Stress Less and Reaching Out When Needed
Everyone confronts times of stress. On a daily basis, stress levels can vary. With the many challenges that farmers and ranchers face, it is important to recognize and learn to manage stress. Stress, especially if it becomes chronic, can adversely affect physical well-being, thoughts, and actions. Taking steps to balance physical and mental wellness is important to staying healthy and less accident-prone.
What can be done about stress? Stress-reducing strategies include:
- Exercise. Physical activity can help clear the mind, reduce anxious feelings, and improve self-worth.
- Sleep. Keeping a healthy bedtime routine can help with calmness, happiness, and better focus throughout the day.
- Nutrition. Reducing sugary foods and adding nutrient-rich foods has been shown to reduce depressive symptoms in adults.
- Connections. Stay connected to family, friends, and your community.
- Relaxation. Taking time for relaxation and recreation will provide a happier frame of mind and more energy to deal with difficult emotions when they arise.
Reaching Out is Nebraska Strong. Learning to recognize your stressors and how to manage stress can help you personally and those around you. If you recognize someone in distress, use a caring approach in listening to them and then connect them to resources. Keep the Rural Response Hotline number (1-800-464-0258) and the Suicide Prevention Hotline number (1-800-273-8255) in your phone contacts.
For more information on mental well-being, go to https://go.unl.edu/stress.
Resources
Cash Rental Rates 2019, United States Department of Agriculture-National Agricultural Statistics Service, September 10, 2019.
Nebraska Crop Budgets 2020, University of Nebraska-Lincoln, Department of Agricultural Economics, November 2019.
Nebraska Farm Real Estate Market Highlights 2018-2019, University of Nebraska-Lincoln, Department of Agricultural Economics, June 2018.
5 Simple Ways to Improve Your Physical and Mental Wellness, David Miers, Bryan Medical Center Mental Health, March 4, 2019.
