Nebraska producers will face challenging margins on crops produced in 2019. This article covers current trends in cash rental rates and outlines financial considerations in making decisions for the upcoming production year.
Cropland Rental Rates
One of the top financial concerns for agricultural producers in Nebraska remains current rental rates paid for cropland. On average, rental rates across the state for dryland and irrigated cropland trended down about two to five percent across Nebraska in 2018 (Table 1). Several regions reported a small percentage increase in cash rent, but these were only noted in a few areas for each type of land.
| Type of Land | Agricultural Statistics District | |||||||
|---|---|---|---|---|---|---|---|---|
| Northwest | North | Northeast | Central | East | Southwest | South | Southeast | |
| - - - - Dollars Per Acre - - - - | ||||||||
| Dryland Cropland | ||||||||
| Average | 28 | 53 | 210 | 89 | 190 | 41 | 76 | 160 |
| % Change | -3 | -4 | -2 | 1 | -3 | 5 | 6 | 3 |
| High Third Quality… | 42 | 87 | 255 | 115 | 230 | 56 | 100 | 205 |
| Low Third Quality….. | 21 | 28 | 175 | 72 | 150 | 35 | 53 | 125 |
| Center Pivot Irrigated Cropland** | ||||||||
| Average | 150 | 200 | 290 | 220 | 280 | 190 | 215 | 260 |
| % Change | -3 | -2 | -5 | -4 | -3 | -5 | -4 | -2 |
| High Third Quality… | 190 | 240 | 330 | 255 | 315 | 215 | 255 | 310 |
| Low Third Quality….. | 115 | 145 | 245 | 195 | 245 | 165 | 180 | 215 |
| Source: Nebraska Farm Real Estate Market Survey 2017-2018. **Cash rents on center pivot irrigated cropland assumes landowners own the total irrigation system. |
||||||||
Productivity of the cropland including soil types, degree of slope, expected rainfall, and location all influence the competitiveness of rent paid in an area, according to those responding to the cash rent survey. These differences by district provide the range and average cash rent from the low third in quality to the high third. Rent for the low third quality of dryland and irrigated cropland dropped at a higher rate than the higher third in quality, suggesting demand for more marginal ground may be diminishing.
The outlook for rental rates in 2019 also may be lower due to tight margins in crop budgets with depressed commodity prices. Producers negotiating cash rents need to focus on communicating market fundamental and production expense in arriving at an equitable rental rate for 2019.
Financial Considerations

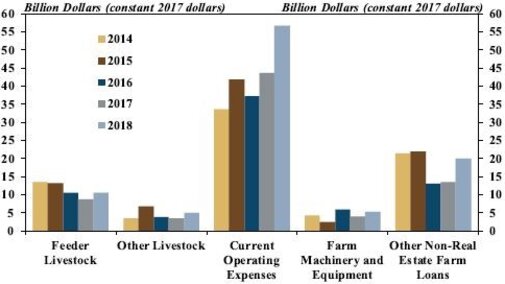
Operating profitability in 2019 requires critical analysis of the finances for an operation. Beyond rent paid for land, many other production or machinery expenses are necessary. Many of these expenses may be financed on a line of credit or short-term loan. The cost of financing agricultural debt in the United States has increased in recent years (Figure 1).
Current operating expenses increased about 72% from approximately $33 billion in 2014 to nearly $57 billion in 2018. Recent survey results from the Agricultural Credit Survey conducted by the Federal Reserve Bank of Kansas City indicate variable and fixed interest rates for agricultural operations appear to be averaging between 5.75% and 6.25%. Agricultural producers must keenly evaluate their interest operating expense and the impact of potential rate hikes in 2019.
2019 Crop Budgets
2019 Nebraska Crop Budgets
CropWatch.unl.edu/budgetsContact: Glennis McClure
Email: gmcclure3@unl.edu
Phone: 402-472-0661
Along with rental rates and interest, additional inputs are highlighted in the 2019 Nebraska Crop Budgets. Nebraska Extension prepares 78 crop budgets annually to assist farm and ranch operators in planning for the upcoming growing season.
- Analysis of the 2019 Nebraska Crop Budgets indicate rising fertilizer prices as one of the major increases in line-item expenses.
- Energy expenses were also higher for the operation of machinery or irrigation equipment.
- Other major input expenses appear to be similar to 2018 prices.
Overall evaluation of the 2019 Nebraska Crop Budgets indicate producers must understand their estimated cost of crop production in 2019 to ensure a financially solvent year. Landlords must also understand these expenses in order to better negotiate equitable cash rental rates on their property.
Contact
Author Jim Jansen, Nebraska Extension economist, can be reached at 402-261-7572 or by email at jjansen4@unl.edu.
Resources
A Dip in the Farm Economy, Ag Credit Survey, KC Federal Reserve, August 9, 2018.
Large-Scale Financing Drives Ag Lending Activity Higher, Ag Finance Databook, KC Federal Reserve, October 19, 2018.
Nebraska Crop Budgets 2019, University of Nebraska-Lincoln, Department of Agricultural Economics, November 2018.
Nebraska Farm Real Estate Market Highlights 2017-2018, University of Nebraska-Lincoln, Department of Agricultural Economics, June 2018.
