Taking care of the chickens was one of my assigned chores back on the farm years ago. I’d guess both of my older brothers were “promoted” from that task to more noble ones like taking caring of the hogs or cattle, or better yet, cultivating corn or soybeans! I learned in the drudgery not only to count the elliptical surprises hidden in straw nests before I got them into the house, but also which of the hens were more reluctant to let me gain access to their warm, oval treasures. We never hatched our own to produce chicks. Young egg gatherers like me might have been tempted to relate egg number with chick numbers and thus, the number of layers or fryers that just might spring from these hard-shelled beginnings without knowing whether the eggs were even fertilized — and in reality, not quite knowing what that meant.

Later I was promoted to cultivating corn and soybeans and then to actually conducting research for nearly 40 years on both of these crops and the cropping systems in which they grow. And I had the pleasure of extending information on how to best grow and manage those crops through Extension programming. Yield affects all else in terms of producing commodity crops: It determines profitability and sustainability.
It is not surprising then that we collectively spend a lot of time talking about bushels per acre prior to harvest — eggs in the basket before they make it to the kitchen. It is also not surprising that we use intricate and intensive field techniques and complex crop models to forecast yields weeks before combines are expected to roll. In fact, I’m part of a group that publishes corn yield estimates in Nebraska Extension’s CropWatch (2018 yield forecast) for multiple Corn Belt locations every couple of weeks in late summer and fall using a crop model.

Among others who provide state and regional yield estimates for both corn and soybeans are Pro farmer Midwest Crop Tour and the USDA National Agricultural Statistics Service (NASS.) Their objectives and techniques differ.
The Pro Farmer tour is designed to “...compare one crop year to the prior crop year...” and not to compare “… how we look at or how USDA looked at the crops.” (Jeff Wilson, Aug 16, 2018. Farm Journal, AgPro). During one week in August scouts drive 20 pre-determined routes across the Midwest stopping to collect data every 15 to 20 miles. Once in a field they follow specific sampling protocols or collect 3 corn ears or 3 soybean plants. Last year in Nebraska they sampled 301 corn and 296 soybean fields.
On the other hand, “Each month [NASS] publishes crop supply and demand estimates for the nation and the world. These estimates are used as benchmarks in world commodity markets because of their comprehensive nature, objectivity, and timeliness.” (See their protocols.) These data “… affect decisions made by businesses and governments by defining the fundamental conditions in commodity markets.”
NASS uses two survey tools to accomplish this for Nebraska crops: Agricultural Yield Surveys (AYS) and Objective Yield Surveys (OY). Multifaceted protocols for these data collection tools are meticulously followed. For 2019 in Nebraska, they expect to summarize 500 to 1000 AYS monthly. For the more intensive OY surveys in Nebraska, they typically sample more than 200 corn fields and more than 100 soybean fields (personal communication, Patrick Boyle, NASS). For the OY, two sampling locations in each of several hundred selected fields are visited monthly from late July through late October to produce the reports published from early August through early November. The summarized annual yields are normally published in January (2018 Crop Production Summary).
NASS follows similar AYS and OY protocols in other states. For example, OY surveys are conducted in the top 10 corn-producing states: Illinois, Indiana, Iowa, Kansas, Minnesota, Missouri, Nebraska, Ohio, South Dakota, and Wisconsin. The number of fields sampled varies with the state.
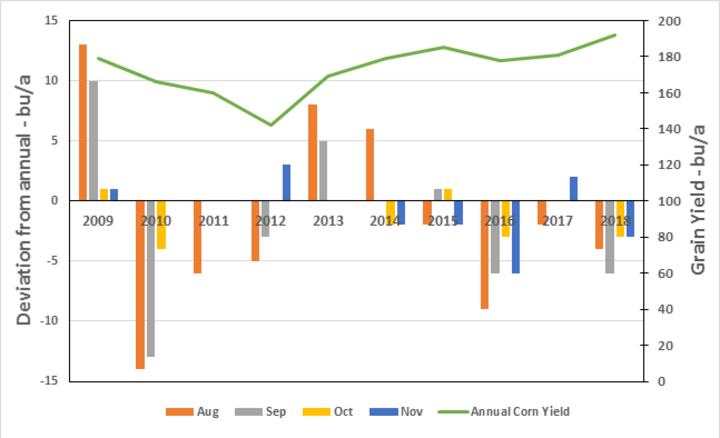
Figure 1 shows data on Nebraska corn yield forecasts for the last 10 years. The closer we get to crop maturity, the smaller the deviations of the monthly estimates to the annual published yield. For this 10-year period, deviations from the annual yields were 6.9, 4.4, 1.6, and 1.9 bu/ac for the August, September, October, and November. reports. That’s a deviation of 1% for the November forecasts. For comparison, the numbers for the same periods for the entire US are similar: 4.1, 3.1, 2.2, and 1.4 bu/ac deviation from the annual yields for the same years and months.
These findings make sense when you understand that during the early OY sampling, the only yield components clearly established are plants per acre and ears per plant. As the season – and sampling – progress, more yield components are set: kernel numbers per plant (rows around x kernels per row) and finally, kernel weights, which are not maximized until physiological maturity.
Final kernel weight is the big unknown in all the pre-mature sampling, whether done by NASS or groups like Pro Farmer. Until we know that last-formed yield component, yields cannot be known with certainty. NASS uses the most recent five years of kernel weight data to estimate yields. The assumption is that the seed-fill length and environment of the current year will be similar to that of the previous five-year average.
Thinking of eggs again, until we hear the shells crack and see the chick struggling successfully into the world of light, air and little farm boys and girls, we shouldn’t get overly ambitious about building a larger coop or using highly anticipated sales income.
With corn and soybeans, treat yield forecasts with some degree of caution early in the seed-fill period. As the seed-fill period progresses and maturity approaches, you can be more confident in the numbers.
