Patricio Grassini, Associate Professor of Agronomy and Horticulture, Extension Cropping System Specialist and Water for Food Institute Fellow; Gonzalo Rizzo, Visiting Scholar; Juan Ignacio Rattalino Edreira, Research Assistant Professor; Haishun Yang, Associate Professor of Agronomy and Horticulture and Water for Food Institute Fellow; Roger Elmore, Professor of Agronomy and Horticulture, Extension Cropping System Specialist and Water for Food Institute Fellow; Keith Glewen, Extension Educator; Jennifer Rees, Extension Educator; Charles Shapiro, former UNL Extension Soils Scientist – Crop Nutrition and Professor of Agronomy and Horticulture (now retired), University of Nebraska–Lincoln
Jeff Coulter, Professor and Extension Specialist, University of Minnesota
Mark Licht, Extension Cropping System Agronomist, and Sotirios Archontoulis, Assistant Professor, Iowa State University
Cameron Pittelkow, Assistant Professor, University of Illinois
Ignacio Ciampitti, Associate Professor of Agronomy and Crop Production and Cropping System Specialist, Kansas State University
Ray Massey, Extension Professor, University of Missouri
Peter Thomison, Extension Specialist and Professor, Ohio State University
Joe Lauer, Professor, University of Wisconsin-Madison
High temperature during vegetative stages had little impact on forecasted yield potential.
This article is the last in a series that summarizes the simulated crop stages and yield forecasts for 41 locations across the US Corn Belt. (See Table 1 summarizing the corn yield forecasts performed on October 16.) Details on the underpinning methodology to simulate phenology and forecast end-of-season yields, as well as on interpretation and uses of yield forecasts, are described in a previous article.

Figure 1. Probability of the 2018 yield potential to be below (10%, green color) the long-term (2005-2017) average yield potential at each location. Separate maps are shown for irrigated corn and rainfed corn. The larger a color section is within the pie chart, the higher the probability that end-of-season corn yield will be in that category. Numbers inside pie charts show forecasted 2018 yield potential.

Irrigated Corn: Above and Near Average Yields
Forecasted end-of-season irrigated yields are shown in Figure 1. About half of the irrigated sites were predicted to reach above-average yield potential (ranging from +10% to +24% above the long-term average), and the rest were forecasted to be close to the average long-term yield potential.
Rainfed Corn: High Yield Variation Across Sites
For rainfed corn, the scenario was more variable. Above-average yield potential was expected for about half of the locations, which were mostly located in Nebraska, Illinois, southwest Ohio, and southern Minnesota. At these sites, yields were forecasted to be 12% to 39% above the long-term average.
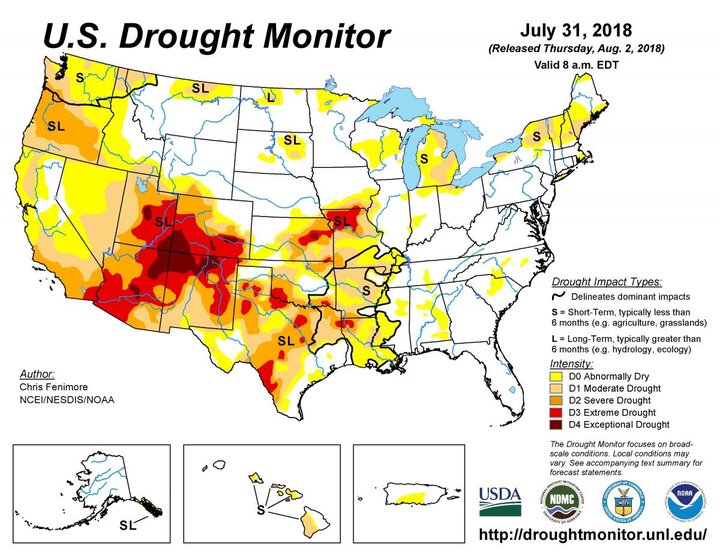
In contrast, below-average yields are forecast for seven sites along a transect that includes portions of northeastern Kansas (Manhattan, Scandia, and Silverlake), northern Missouri (St. Joseph and Brunswick), and northwestern and southeastern Iowa (Sutherland and Crawfordsville). This is attributable to a severe drought that affected corn in that region during July and August, which coincided with the critical period for yield determination (Figure 2; www.droughtmonitor.unl.edu). Yield was also forecasted to be below average at the northern sites (Dazey, North Dakota and Eldred, Minnesota) and northeast Iowa (Sutherland). At these sites, yield reductions were expected to be 11% to 59% below the long-term average. Finally, near-average yields were forecasted for the rest of the sites (ranging from -8% to 8% of the long-term average), which were mostly located in Iowa, Indiana and Ohio.
In contrast, below-average yields are forecast for seven sites along a transect that includes portions of northeastern Kansas (Manhattan, Scandia, and Silverlake), northern Missouri (St. Joseph and Brunswick), and northwestern and southeastern Iowa (Sutherland and Crawfordsville). This is attributable to a severe drought that affected corn in that region during July and August, which coincided with the critical period for yield determination (Figure 2; www.droughtmonitor.unl.edu). Yield was also forecasted to be below average at the northern sites (Dazey, North Dakota and Eldred, Minnesota) and northeast Iowa (Sutherland). At these sites, yield reductions were expected to be 11% to 59% below the long-term average. Finally, near-average yields were forecasted for the rest of the sites (ranging from -8% to 8% of the long-term average), which were mostly located in Iowa, Indiana and Ohio.


Figure 3. Box plots indicate the long-term (2005-2017) duration of vegetative and reproductive stages, with the 25th and 75th percentiles of the duration distribution represented by the box. The red dots indicate the 2018 forecasted phenology by Oct. 16 based on average 2018 planting date at each location. Separate charts are shown for irrigated corn and rainfed corn.
High temperatures early in the season (June) increased the rate of corn development, causing corn to reach black layer one to three weeks earlier than normal at most locations (Figure 3). However, this did not lead to a yield penalty at most sites because temperature remained near-normal during the rest of the season, resulting in a duration of grain filling that was similar to the long-term average. In other words, the duration of silking and grain filling were not different from a normal year—they just occurred earlier as consequence of a shorter vegetative phase.
