Nebraska crop producers face challenging financial circumstances in 2018 with low commodity prices and the management of rented cropland. Making informed decisions when renting or purchasing cropland becomes even more important with tighter production margins for producers.
Cropland Values
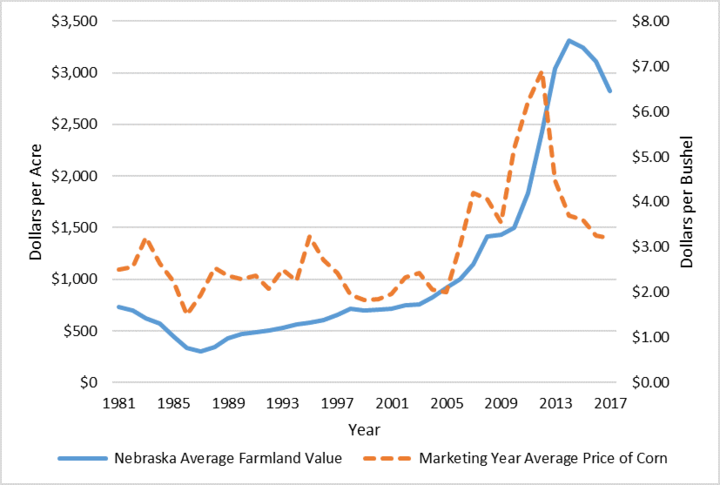
The Nebraska all-land average price set highest nominal (non-inflation adjusted price) in 2014 at $3,315 per acre and has since declined $495 over the last three years to $2,820 per acre during the 39-year history of the UNL Nebraska Farm Real Estate Market Surveys (Figure 1).


Record setting marketing-year average price for corn of $6.89 per bushel set in 2012 declined approximately 54 percent to $3.20 per bushel in 2017. Survey members indicated the current price of commodities as a leading factor attributing to lower expectations for land values.
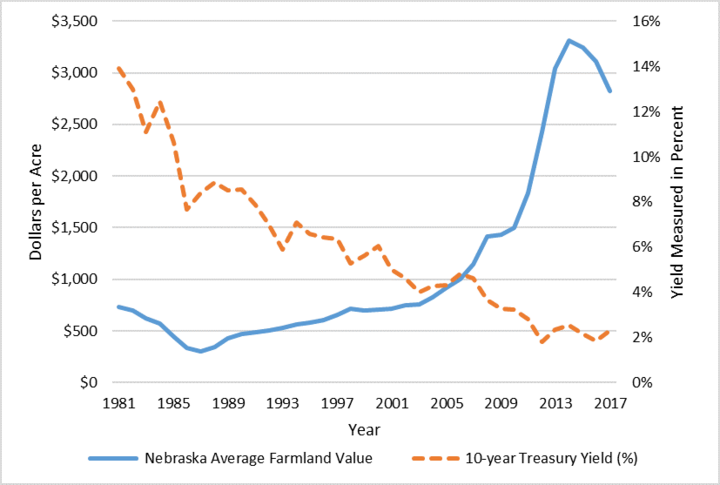
Another important factor influencing the value of land relates to the cost of financing new farm real estate purchases. Nebraska average farmland values and the annual yield on 10-year Treasury bonds displays this relationship (Figure 2). The yield on 10-year Treasury bonds tends to be highly correlated with the cost of borrowed funds. In general, the relationship between farmland values and the yield on Treasury bonds carry a negative tendency meaning as bond yields increase farmland values fall.
Interest rates and bond yields are positively correlated, meaning an increase in the Federal Funds Rate tends to correlate with increases in rates and yields on securities with longer maturities such as the 10-year Treasury bond. In addition, expectations of a stronger economy often send signals to investors that Treasury bonds are less appealing from a risk-return standpoint.
As capital leaves the bond market, bond prices fall and yields on those securities rise. An increase in the yield on 10-year Treasury bonds may have the effect of pushing farmland values lower as interest rates on loans increase. With the potential for interest rates to increase and net farm operating income to remain stagnant or lower, farmland values may experience more downward pressure in 2018.
Cropland Rental Rates
Rental rates across the state marked varying degrees of declines (Table 1). Dryland cropland reported a decline of 9 to 10 percent in the northwest and south districts, but only slightly lower rates were reported in the northeast and east districts. Irrigated cropland reported a decline of closer to 10 percent across the state except for the central at about 4 percent.
| Type of Land |
Northwest | North Ag Statistics District $/ac | Northeast Ag Statistics District $/ac | Central Ag Statistics District $/ac | East Ag Statistics District $/ac | Southwest Ag Statistics District $/ac | South Ag Statistics District $/ac | Southeast Ag Statistics District $/ac |
|---|---|---|---|---|---|---|---|---|
| Dryland Cropland | ||||||||
| Average | 29 | 55 | 215 | 88 | 195 | 39 | 72 | 155 |
| % Change | -9 | -8 | -4 | -8 | -3 | -7 | -10 | -6 |
| High Third Quality | 41 | 67 | 265 | 120 | 235 | 56 | 115 | 200 |
| Low Third Quality | 23 | 41 | 170 | 68 | 155 | 28 | 56 | 130 |
| Center Pivot Irrigated Cropland** | ||||||||
| Average | 155 | 205 | 305 | 230 | 290 | 200 | 225 | 265 |
| % Change | -9 | -7 | -12 | -4 | -9 | -11 | -6 | -9 |
| High Third Quality | 200 | 240 | 350 | 270 | 325 | 245 | 270 | 315 |
| Low Third Quality | 125 | 160 | 250 | 215 | 245 | 185 | 195 | 225 |
The outlook for rental rates in 2018 may be lower due also to net farm operating income being stagnant or lower with current commodity prices.
Further Readings
Nebraska Farm Real Estate Market Highlights Report: http://agecon.unl.edu/realestate
