Nebraska Weather: Variability is the Norm

Nebraska Weather: Variability is the Norm

Snow-covered corn Oct. 14 near Lincoln. (Photo by Craig Chandler)
Here today, gone tomorrow. Harvest was barely underway in many areas when a heavy, wet snow fell Sunday, Oct. 14, often on already-saturated soils. (Photo by Craig Chandler, UNL)

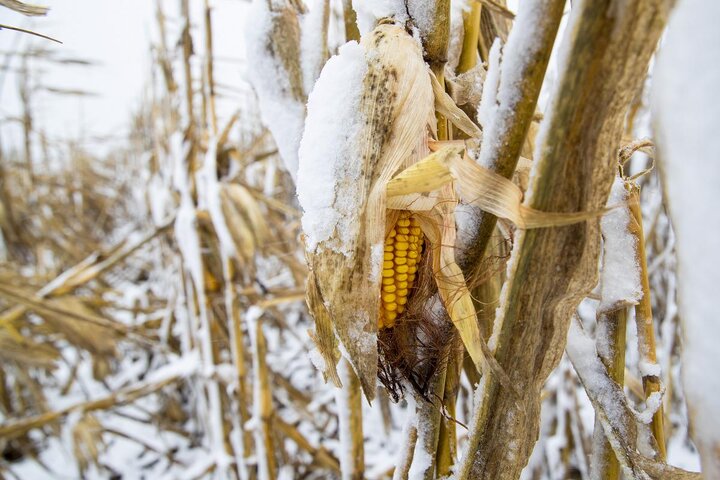
When a heavy, wet snow fell last Sunday, the state's corn harvest was just 25% done and soybean harvest, just 38%, according to Monday's USDA NASS Crop Report.

On Sunday parts of south central Nebraska had as much as 7 inches of snow and the Lincoln area had 3-5 inches. Growers in Saline County said they couldn't remember unharvested soybeans with this much snow, said Extension Educator Randy Pryor.

While it seems early for this much snow, really how unusual is an Oct. 14 snow?

That was the question University of Nebraska-Lincoln Applied Climatologist Ken Dewey looked at for Lincoln. While Nebraskans know how quickly the weather can change from one day to the next, Dewey's graphs show just how much it varies from year to year. The average date for the first measurable snowfall in Lincoln, based on data from 1948-2018, is Day 322. In 2018 Day 322 falls on Nov. 18, more than a month after the first measurable snowfall. (See a chart of Day Numbers for 2018.)

The other charts, all for Lincoln, show the dates of the first freeze after summer 1887-2018, the date of the last measurable snowfall after winter (1948-2018), and the date of the last freeze after winter (1887-2018).

Dewey first published these charts on Twitter at @kdewey1unl.

Graph showing dates of first measurable snowfall after summer 1948-2018
Figure 1. Date of first measurable snowfall after summer in Lincoln from 1948-2018. Red line indicates the average, calendar day 322. (All charts courtesy of Ken Dewey)

Length of growing season, 1887-2018
Figure 3. Length of growing season at Lincoln, Nebr., 1887-2018. Red line indicates average, calendar day 86.
Graph of first freeze after summer 1887-2018
Figure 2. Date of the first freeze after summer in Lincoln from 1887-2018. Red line indicates the average, calendar day 285.

Graph of the dates of the last freeze after winter, 1887-2018
Figure 4. Date of last freeze after winter at Lincoln, Nebr., 1887-2018. Red line indicates average date, calendar day 113.

Online Master of Science in Agronomy

With a focus on industry applications and research, the online program is designed with maximum flexibility for today's working professionals.

A field of corn.