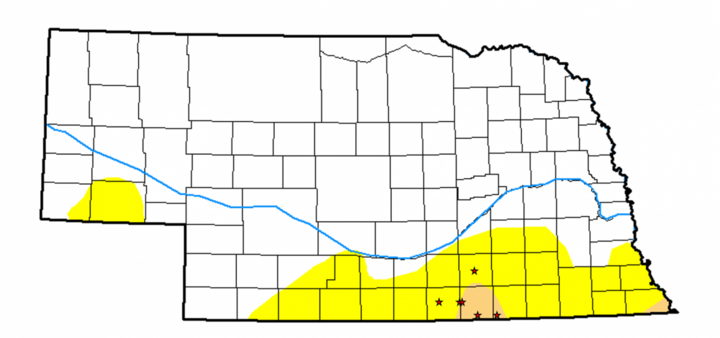
The current Drought Monitor shows 19% of Nebraska in the “abnormally dry” or “moderate drought” categories and in the shadow of large-scale drought in Kansas (97%) and Colorado (88%). Being curious about beginning soil moisture in non-irrigated situations, we installed Watermark soil moisture sensors in six non-irrigated, no-till locations in Webster, Nuckolls, Thayer, and Clay counties.
Purpose
This quantitative information can be helpful as growers make planning and planting decisions. Granted, most planting decisions have already been made with inputs already purchased. Spring rains are also typically expected. However, information like this can help a grower be flexible in that planning should anticipated rains not be timely.
- The grower may choose to plant a more drought-tolerant crop like sorghum or a more drought-tolerant corn hybrid.
- A grower with livestock may choose to plant a feed/forage crop.
- A grower may choose to not terminate a growing cover crop such as rye, instead growing it for feed.
Process
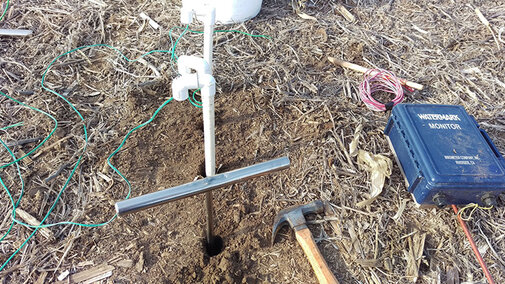
Soil moisture sensors were installed at 1-, 2-, 3-, and 4-foot depths in non-irrigated, no-till corn and soybean residue fields near Byron, Superior, Lawrence, Bladen, and Clay Center (Figure 2). The sensors were connected to Watermark dataloggers from the Irrometer company. Because the default soil temperature on the dataloggers is 70°F, a temperature sensor is also installed to ensure correct calibration of the soil moisture. This is because soil temperature during this time is dfferent (much lower) than 70°F.
Any farmer or crop consultant could do the same for his/her fields to determine the same information and wouldn’t need the datalogger. Taking weekly readings at the same time each week, or even daily at the same time, would also give one an idea of beginning soil moisture. It’s best to allow at least 48-72 hours for the sensors to equilibrate to the current soil moisture conditions. This process is essentially the same as when sensors are installed for irrigation scheduling. The difference is these are non-irrigated fields with no current crop growing. For additional information and videos on using watermark sensors, please see the Nebraska Agricultural Water Management Network website.


Other Observations
Nuckolls County is shown as in “moderate drought” on the Drought Monitor. At the Superior location, we were hoping to also install into actively growing rye and winter-killed forage to determine beginning soil moisture in those conditions. The rye is currently 6 inches tall in the tillering stage and the soil probe wouldn’t go in the ground beyond 6 inches, so no moisture sensors were installed. The soil probe would only go in 12 inches in the winter-killed forage consisting of sorghum-sudan and radishes; thus, soil moisture sensors weren’t installed in that field either.
Results so Far
During installation, the 3- and 4-foot depths at all locations (only 4-foot at Clay Center) seemed very dry. The soybean residue appeared drier than corn residue. Two sites are located near Lawrence, one in corn residue and one in soybean residue across the road from each other. That data shows differences in moisture between different residue types the most clearly. We were unable to install to the 4-foot depth at the Lawrence soybean residue location. At most other sites, a hammer was used to help install to 4 feet. However, given the difficulty in installing the 4-foot sensor, these graphs do not show them as dry or drier than the 3-foot at any location other than Bladen.
This could be due to several reasons:
- The soil textural properties at 4-foot depth could have more clay and higher soil bulk density in which the drier conditions would not be obvious or easily determined just by installation difficulty.
- There could be a compacted layer.
- The dryness or wetness of any given soil layer at any given time is a function of various factors including the farming history of the field, previous several years of root development in different layers, previous year's precipitation amount and distribution during the season as well as during off-season, evaporation rate, and water uptake pattern of the crop from different soil layers as water update from different soil layers varies and also varies with time during the season.
- The 4-foot layer may not actually be drier than the 3-foot layer.
Because only a few days of data are shown thus far, it is difficult to make a determination at this time. Data will continue to be collected until each field is planted and the results will be posted weekly at http://jenreesources.com. Additional information regarding each location is in each figure caption.
