Patricio Grassini, Associate Professor of Agronomy and Horticulture, Extension Cropping System Specialist and Water for Food Institute Fellow; Gonzalo Rizzo, Visiting Scholar; Juan Ignacio Rattalino Edreira, Research Assistant Professor; Haishun Yang, Associate Professor of Agronomy and Horticulture and Water for Food Institute Fellow; Roger Elmore, Professor of Agronomy and Horticulture, Extension Cropping System Specialist and Water for Food Institute Fellow; Keith Glewen, Extension Educator; Jennifer Rees, Extension Educator; Charles Shapiro, former UNL Extension Soils Scientist – Crop Nutrition and Professor of Agronomy and Horticulture (now retired), University of Nebraska–Lincoln
Jeff Coulter, Professor and Extension Specialist, University of Minnesota
Mark Licht, Extension Cropping System Agronomist, and Sotirios Archontoulis, Assistant Professor, Iowa State University
Cameron Pittelkow, Assistant Professor, University of Illinois
Ignacio Ciampitti, Associate Professor of Agronomy and Crop Production and Cropping System Specialist, Kansas State University
Ray Massey, Extension Professor, University of Missouri
Peter Thomison, Extension Specialist and Professor, Ohio State University
Joe Lauer, Professor, University of Wisconsin-Madison
This article summarizes the simulated crop stages and yield forecasts performed on August 22 for 41 locations across the US Corn Belt; the data can be viewed here. Details on the underpinning methodology to simulate phenology and forecast end-of-season yields, as well as on interpretation and uses of yield forecasts, are described in a previous article.
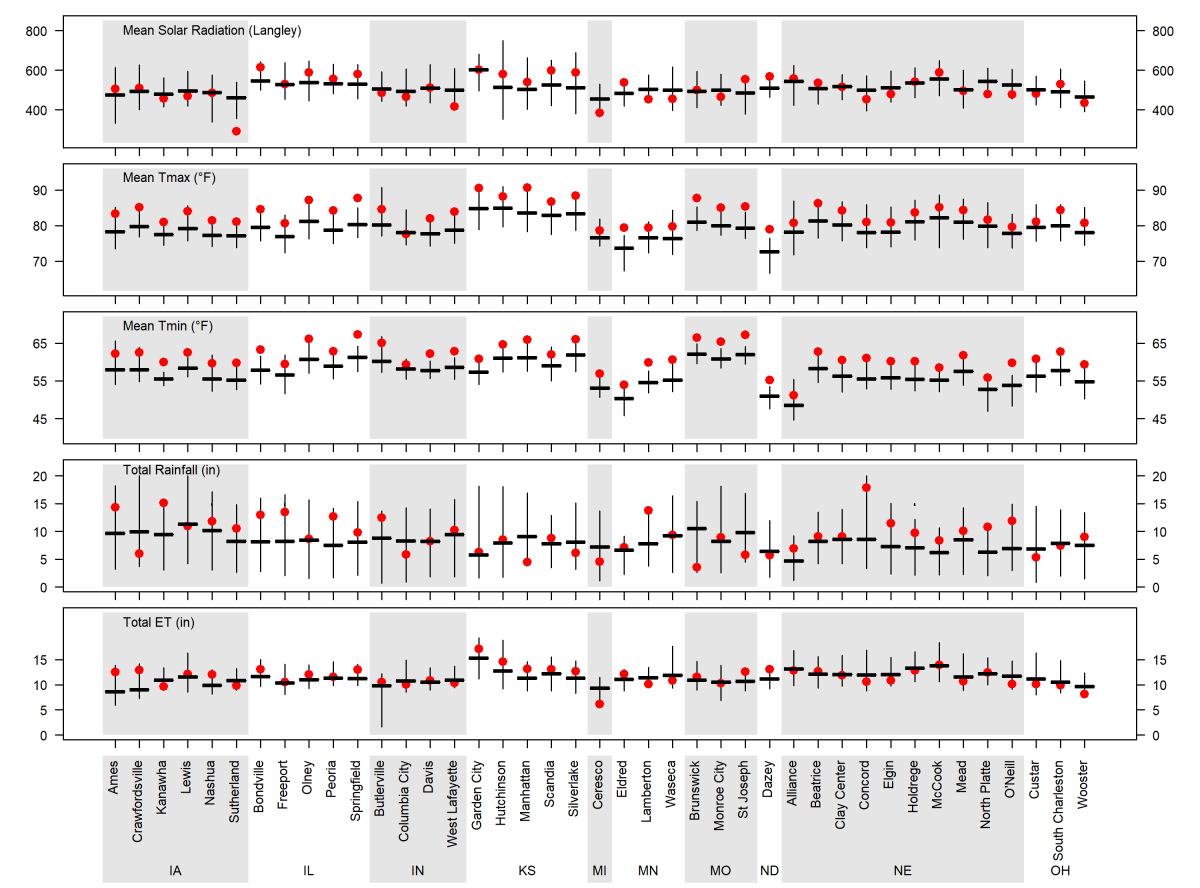
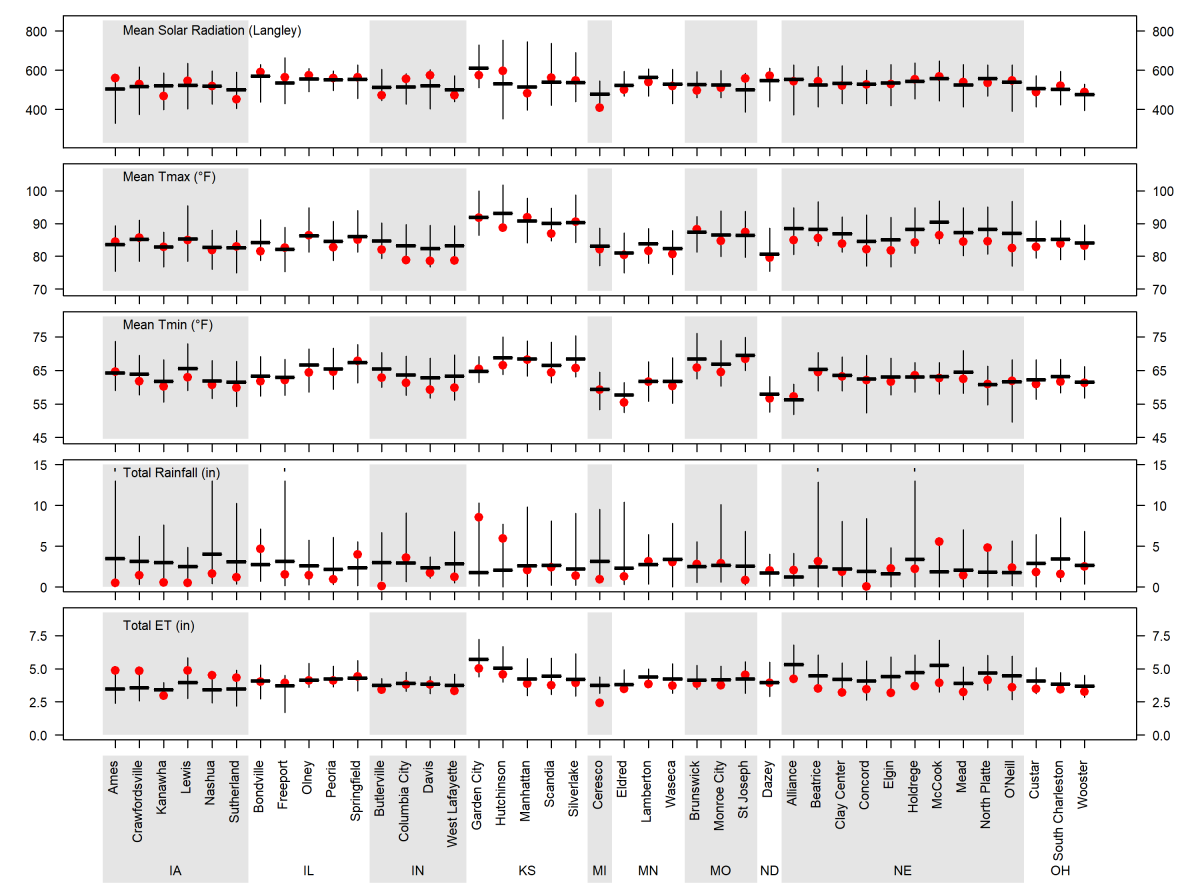
During the last three weeks, air temperature and solar radiation were similar to the historical average. Rainfall records were also near-normal values, except for some locations in Iowa, Illinois, Indiana, Kansas, and Ohio where rainfall was well-above normal. A summary of weather conditions during the last three weeks is shown in Figure 1.

Figure 1. Daily solar radiation, maximum and minimum air temperature (Tmax and Tmin), total rainfall, and total reference grass-based evapotranspiration (ET) for the time period between August 1 and August 22, 2018. Vertical bars indicate the range for these variables based on 20+ years of weather records. The horizontal thick line indicates the long-term average and the red dots indicate the 2018 values.
View
forecasted yields, long-term average yields, and current simulated crop stages for all sites.

R4: dough; R5: dent; physiological maturity: matured. Separate charts are shown for irrigated corn and rainfed corn.

Simulated Corn Stage Across 41 Locations
Corn has reached kernel dent stage at most locations, except for a few locations in the eastern, northern, and western fringes of the region (Figure 2). Corn reached physiological maturity (black layer stage) at almost all sites in Missouri, Kansas, and southern Illinois.
As reported in a previous article based on forecasts performed on July 11, high temperatures at the beginning of the season accelerated corn development across the entire region. However, temperature since the July 11 forecast (which includes silking and early grain-filling stages) remained near normal. Still, most sites are expected to reach black layer (if not already) one to three weeks earlier than the historical average (Figure 3). This pattern is less evident in the western fringe of the region where some sites will likely reach maturity near the long-term date.

Figure 3. Probability of the 2018 physiological maturity (“black layer”) to be earlier, near, or later than the long-term (2005-2017) average date at each location. Date shown inside the pie chart indicates the 2018 forecasted physiological maturity date if the season continues from now until the end of the crop cycle with average weather. “Matured” is indicated when the crop has already reached black layer. Separate maps are shown for irrigated corn (top) and rainfed corn (bottom). The larger a color section is within the pie chart, the higher the probability that end-of-season date of black layer falls on that category.


Figure 4. Vertical lines indicate the range of forecasted 2018 corn yield potential by August 22 based on average 2018 planting date at each location. Horizontal lines indicate the 25th and 75th percentiles of the yield distribution (associated with respective adverse and favorable weather scenarios for the rest of the season). The blue squares indicate the long-term (2005-2017) average yield potential at each location and the red dots represent the forecasted 2018 corn yield potential at sites that have already reached maturity. Separate charts are shown for irrigated corn and rainfed corn.
Irrigated Corn: High Probability of Near-Average Yields
The range of forecasted irrigated corn yield potential for each location, as well as the probabilities for yields above, near, or below average, are shown in Figures 4 and 5. Almost half of the irrigated sites exhibit a high probability (>75%, that is, three out of four chances) of near-average yield potential, and only two sites exhibited a high probability of above-average yields.
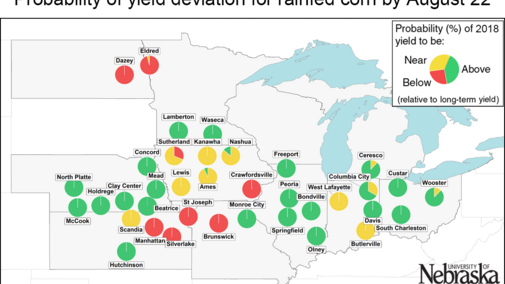
Rainfed Corn: Yield Potential Is Highly Variable Across Rainfed Sites
We can already tell whether end-of-season yield potential will be below, near, or above the long-term average for all rainfed sites (Figures 4 and 5). However, forecasted yield potential is highly variable across rainfed sites. In general, yield potential is above average in Nebraska, Illinois, Ohio, Michigan, southern Minnesota, and a few sites in Indiana, Missouri, and Kansas. In contrast, there is a high probability of below-average yield at five sites located along a transect that includes portions of northeastern Kansas (Manhattan and Silverlake), northern Missouri (St. Joseph and Brunswick), and southwestern Iowa (Crawfordsville). Yield is also forecasted to be below average at the northern sites in North Dakota (Dazey) and Minnesota (Eldred). Near-average yields are likely at most sites in Iowa and two sites in Indiana (Butlerville and West Lafayette).

Figure 5. The probability of the 2018 yield potential to be below (10%, green color) the long-term (2005-2017) average yield potential at each location. Separate maps are shown for irrigated corn and rainfed corn. The larger a color section is within the pie chart, the higher the probability that end-of-season corn yield will be in that category.

State and Regional Forecasted Corn Yields
Our yield forecasts were upscaled to state level using the spatial framework of the Global Yield Gap Atlas (www.yieldgap.org), which is based on agro-climatic zones and distribution of corn harvested area. Forecasted yield potential for 2018 for each state and water regime, as well as for the entire region, are shown below. Forecasted 2018 yield potential falls:
- well above average (20% or more) for rainfed corn in Ohio, Illinois, Minnesota, and Nebraska.
- near average (plus or minus 10%) for rainfed corn in Illinois, Iowa and irrigated corn in Nebraska and Kansas.
- below average (more than 15% below average) for rainfed corn in Missouri and Kansas.
| State* | Water regime | Forecasted 2018 yield potential (bu/ac)** | Long-term yield potential (bu/ac)† | % deviation ‡ |
|---|---|---|---|---|
| NE | Irrigated | 258 | 238 | 8 |
| Rainfed | 204 | 136 | 50 | |
| KS | Irrigated | 235 | 224 | 5 |
| Rainfed | 88 | 122 | -28 | |
| IA | Rainfed | 201 | 211 | -5 |
| MN | Rainfed | 237 | 188 | 26 |
| MO | Rainfed | 138 | 170 | -19 |
| IL | Rainfed | 244 | 186 | 31 |
| IN | Rainfed | 232 | 223 | 4 |
| OH | Rainfed | 244 | 202 | 21 |
| REGIONAL AVERAGE § |
218 | 196 | 11 | |
| * North Dakota and Michigan were not included because we only forecasted yield potential for one site at each of these states. Note that uncertainty in Minnesota statewide yield potential is also higher due to the small number of sites for which yield potential was forecasted ** Based on our median 2018 forecasted yield potential estimated for each location † Simulated long-term average yield potential using 25 years of historical weather data ‡ Deviation of forecasted 2018 yield relative to long-term average yield potential § Regional yield average, including both irrigated and rainfed crops, estimated based on the forecasted yield potential for the eight states listed above, weighted by their statewide corn harvested areas |
||||
Conclusions
Corn in most of the region has already reached the dent stage and in the southern region, it’s reached physiological maturity. High temperatures early in the season increased the rate of corn development, causing corn to reach black layer one to three weeks earlier than normal across most locations. Interestingly, simulations suggest that the shorter crop cycle did not lead to below-average yield potential (except for the two sites in North Dakota and northern Minnesota). This may be attributable to the occurrence of high temperatures especially during vegetative stages (see July 11 forecast, Figure 1), but not during the silking and grain filling stages (see Figure 1 and August 1 forecast, Figure 1). In other words, the duration of the critical phases for yield determination (silking and grain filling) was not substantially different from a normal year—they just occurred earlier as a consequence of the shorter period of vegetative growth.
For irrigated corn, there is a high probability of near-average yields for most sites. For rainfed corn, most sites in the region are expected to yield above or near the long-term average, except for some sites in Kansas, Iowa, and Missouri, and the two northern locations in North Dakota and Minnesota that have a high probability of below-average yields. Overall, we forecasted regional corn yield potential to be above (+11%) the historical average, with rainfed yields well above average (>20%) in Ohio, Illinois, Minnesota, and Nebraska.
These forecasts do not take into consideration problems with stand emergence, hail/flooding damage, replanting situations, disease, or nitrate leaching. In fields negatively affected by these constraints, actual yields will be lower than estimates provided here. It is important to keep in mind that yield forecasts are not field-specific and, instead, represent an estimate of average on-farm yield for a given location and surrounding area in absence of the yield-reducing factors mentioned here. Likewise, crop stages and forecasted yields will deviate from those reported here in fields with planting dates or hybrid maturities that differ markedly from those used as the basis for these forecasts. We will follow up with the final forecasted yield and analysis of the 2018 crop season on Sept 7.
