As harvest begins, growers are seeing the results of the season's weather, as well as other factors affecting yield and quality. Following is a month-to-month look at weather conditions that influenced crop growth and pest development.
April
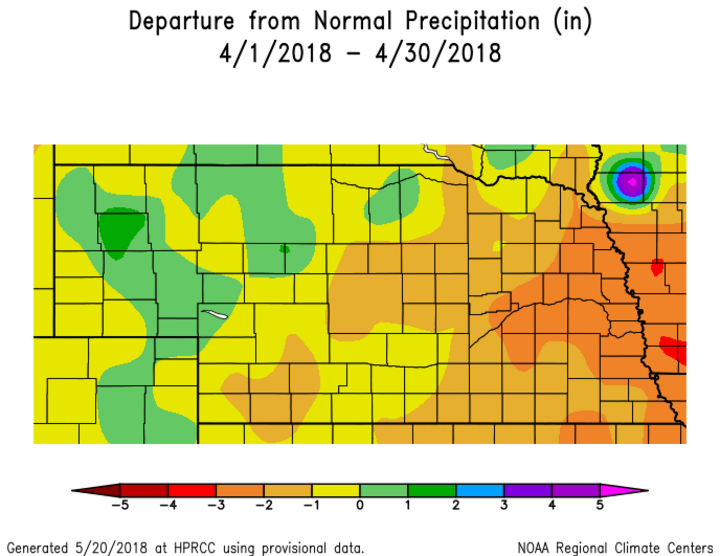
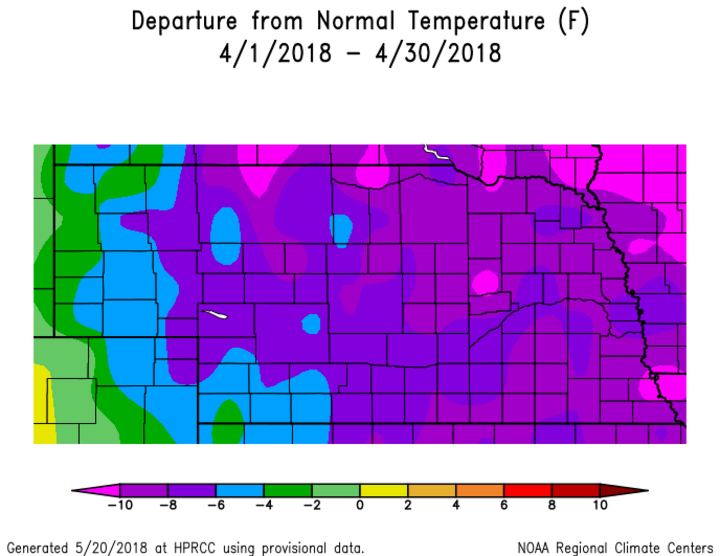
Temperatures during the first week of April were above normal, then the bottom fell out of the thermometer, so to speak. Preliminary data indicates the state average temperature came in 3rd coldest since 1895, while precipitation ranked the 32nd driest since records began. Precipitation was particularly heavy during the final 10 days of April, with the heaviest moisture reported across northeast and north central Nebraska. The combination of cool conditions and localized heavy precipitation led to planting delays, germination challenges, and side-wall compaction. The cool temperatures also played a role in extra tillage passes, which aided in severe wind erosion to end the month.
May
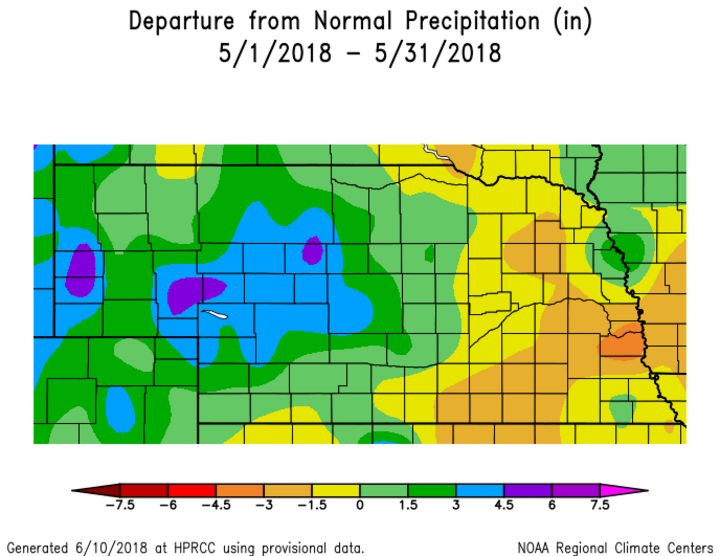
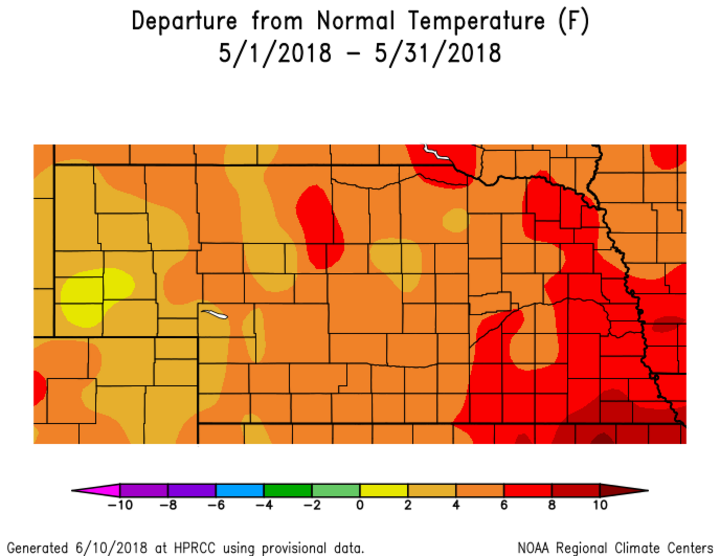
After near record cold during April, May temperatures flipped 180 degrees and the preliminary state temperature ranking came in at 121st warmest since 1895, while precipitation ranked the 100 wettest since records began. Well above normal precipitation was reported across the western half of the state, while east central and southeast Nebraska accumulated deficits of 1 to 3 inches during the month.
It wasn’t until May 20 that the state corn crop reached the 75% planting mark, according to the Nebraska Agricultural Statistics Service. Intense heat developed during the second half of May, with upper 90s to low 100s reported statewide May 25-28, possibly stressing early emerged corn that had not completely canopied and shaded soil surfaces. The warmth provided a quick start to the seasonal Growing Degree Day accumulation and the rapid growth of crops (and weeds) created narrow windows for proper herbicide applications. Crops in most locations in Nebraska finished ahead of schedule, primarily due to this early season warmth.
June
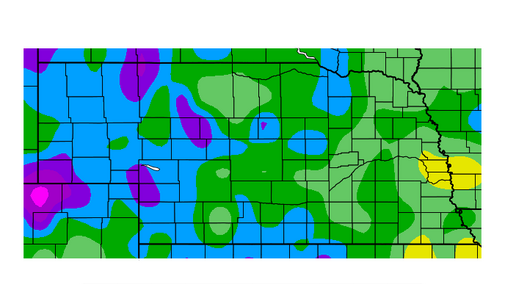
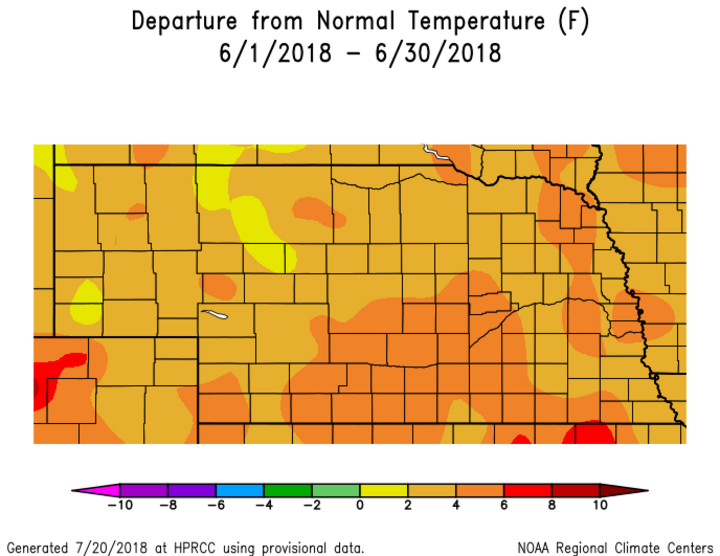
Preliminary data indicated that June ranked 111th warmest since 1895, while precipitation ranked 109th wettest since records began. The intense heat from May continued through the first half of June. High temperatures were consistently in the 90s to low 100s before temperatures cooled back to near normal during the second half of the month. Temperatures averaged 4.5-7.5 degrees above normal, with the greatest departures confined to central and south central Nebraska.
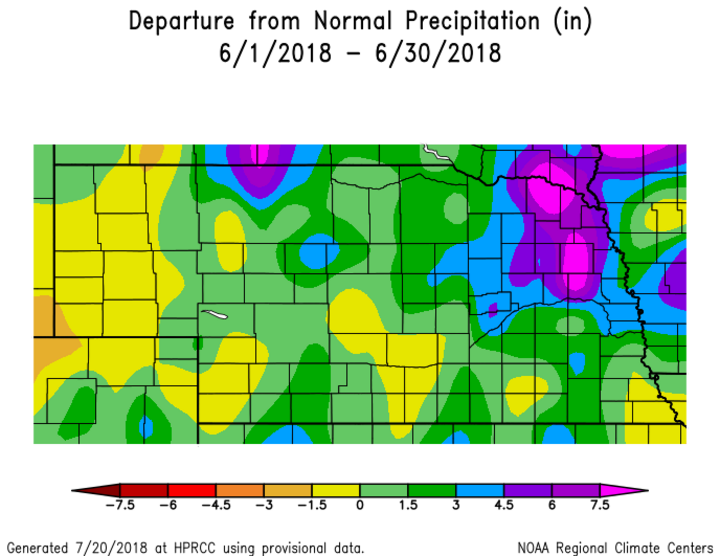
Precipitation was heavy across north central and northeastern Nebraska during the month. Significant delays were reported from producers attempting to bale first cutting hay and/or attempting to complete herbicide treatments due to wet soils. Thunderstorm activity increased dramatically the final 10 days of the month across south central, southeast, and east central Nebraska, temporarily alleviating drought stress on rapidly growing crops.
Multiple hail events began to “scar” the crop landscape in early June and continued to leave their mark across Nebraska throughout the season. Nebraska had 93 large hail reports to the National Weather Service in June and has had a total 299 large hail reports through September 17, which is fourth highest of any state in the U.S.
July
Just like 2017, this July cooled dramatically compared to the previous month. Temperatures were normal to slightly above normal during the first 10 days of July, but cooler than normal temperatures dominated the remainder of the month. Preliminary data indicates that July was the 40th coldest since 1895. Average temperatures were generally 1-2 degrees below normal, with small pockets of 3-4 degrees below normal. Near normal conditions were most common across the northern Panhandle. The cool conditions likely limited drought stress for areas of the state that failed to receive normal moisture during the month. It was also timely since most of the corn in Nebraska was at, or near, pollination when the cool weather set in; however, the scales at harvest will tell the true impact after an exceptionally warm first half of summer.
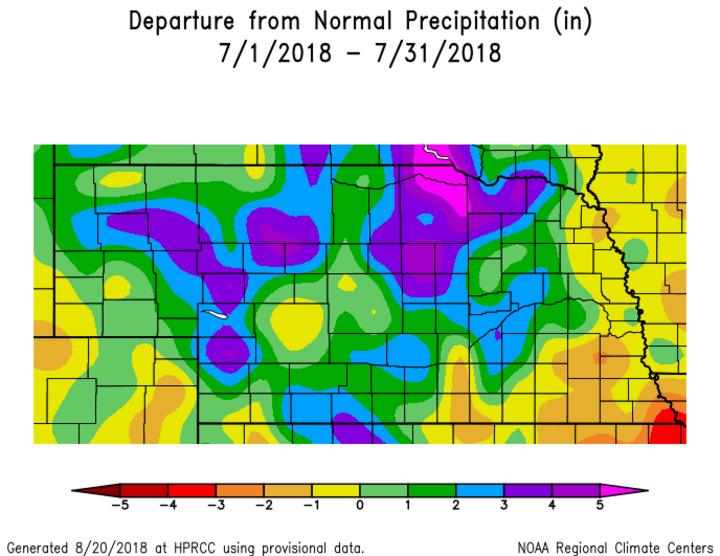
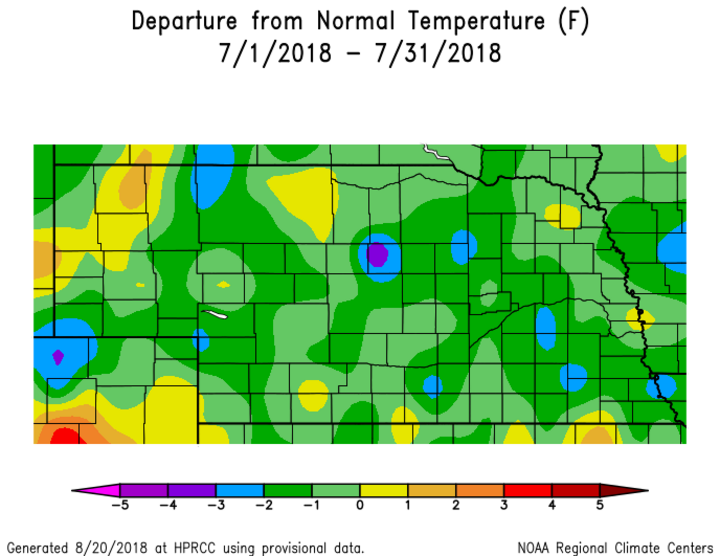
State rankings for July indicated a continuation of the wet trend from June, as the state ranked 112th wettest since 1895. Precipitation ranged from 2-6 inches above normal in pockets from the western Sandhills eastward into the western half of northeast Nebraska. Producers continued to be challenged with hay harvest across the Sandhills due to insufficient drying between precipitation events. In portions of southeast and south central Nebraska precipitation deficits for the month exceeded 2 inches. Although rainfall was reported early in the month, dry conditions the second half of the month led the U.S. Drought Monitor to increase drought from abnormally dry to moderate/severe drought for extreme southeastern and south central Nebraska.
August
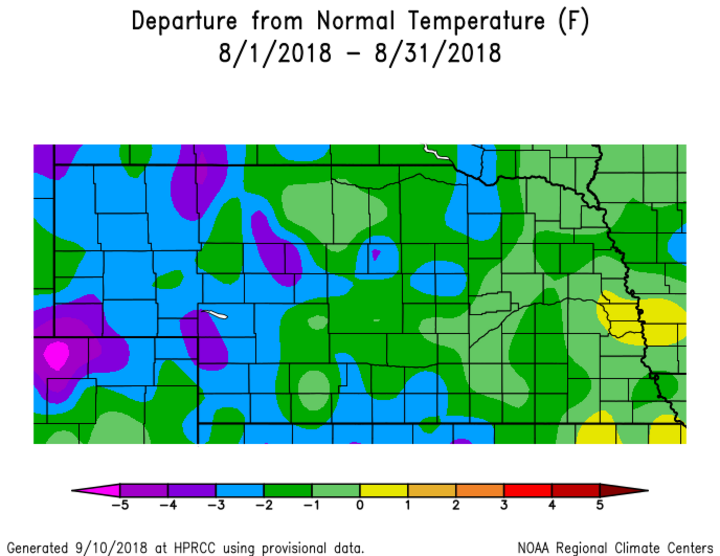
Temperatures were cooler than normal for the second consecutive month. Preliminary data suggests that August will rank 34th coolest since records began in 1895. Eastern Nebraska averaged normal to 2 degrees below normal, while western Nebraska averaged 2-4 degrees below normal. Above normal temperatures were most common near the end of the month and were responsible for near normal temperatures across extreme eastern Nebraska.
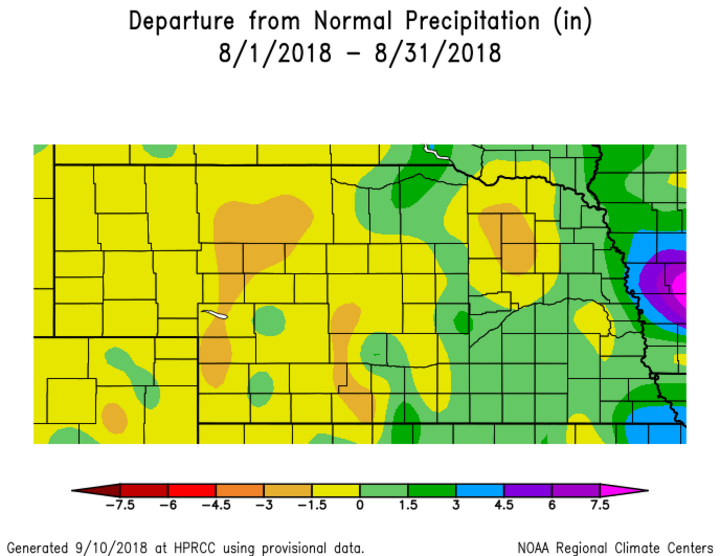
Statewide precipitation for August came in at 54th driest over the past 124 years. Dryness increased crop deterioration across southeast and portions of south central Nebraska during the first half of the month. Abnormal dryness spread northward across the eastern third of the state, with corn and soybean deterioration noted by Extension Educators on the western side of the Loess Hills.
Heavy rainfall was reported during the last week of the month, especially across drought-stricken areas of southeast and south central Nebraska. At the same time, much of the western half of the state received below normal moisture, with the driest locations relegated to the western Sandhills, where deficits over 1.50 inches were reported.
Season-long Humidity
High humidity was also a factor for most of the growing season. From May 1 to August 31, multiple Nebraska Mesonet stations showed above average relative humidity values (Table 1). This limited hay drying and likely increased disease pressure.
| Station | 2018 (%) | Departure from station average (30+ years) (%) |
|---|---|---|
| Concord, 2 mi E | 76.2 | 4 |
| Curtis, 1 mi N | 67 | 4.1 |
| Dickens, 9 mi N | 68.7 | 4.4 |
| Emmet, 2 mi E | 74.7 | 5.8 |
| Gordon, 4 mi SE | 66.4 | 5.8 |
| Harvard, 4 mi SW | 75 | 2.6 |
| Ithaca, 3 mi E | 74.5 | 2.5 |
| Lincoln, (45th St.) | 68.8 | 1.6 |
| McCook, 4 mi NE | 66.5 | 4.6 |
| North Platte, 3 mi SW | 66.6 | 1.5 |
| Sidney, 2 mi NW | 63.4 | 6.7 |
| Walton, 5 mi NW | 70.6 | 1.7 |
| West Point, 2 mi W | 75.5 | 3.4 |
| Whitman, 5 mi NE | 68.7 | 3.9 |
