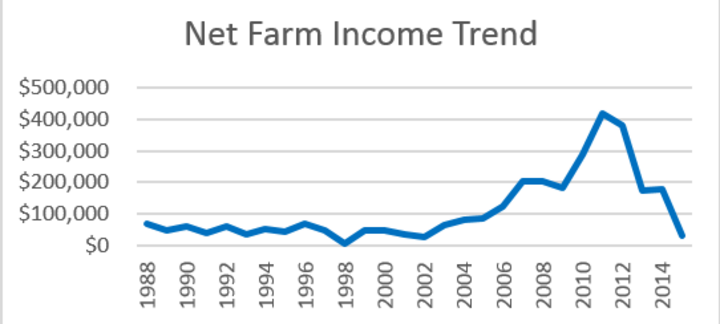
Some say we are experiencing a “new normal” in agriculture. Others say it’s an “old normal.” The data seems to show it is both. While net farm income in 2015 fell to a level lower than we’ve seen since 2002, it is within a range that was considered “normal” at that time. However, the factors that contributed to net income being similar to 2002 are very different.
Table 1 shows just a few comparative factors between 2002 and 2015 for a group of farmers I work with through Nebraska Farm Business, Inc (NFBI). Other than net farm income and average crop acres, very little is the same. Some things are much improved, such as Debt-to-Asset Ratio and Working Capital to Gross Revenues. Others show areas of concern such as the risk of carrying higher debt and the much higher cost of living. It is also interesting to think back to a time when soybeans were less than $5 per bushel and we were very happy about an average corn price above $2 per bushel!
Net Farm Income
When examining the group of farmers served by the Nebraska Farm Business, Inc., the 2015 average accrual net farm income was $29,432. This is a drop of over 80% from the 2013 and 2014 net farm incomes, both of which were about $175,000. While all segments of the farm economy dropped in net farm income, the beef industry dropped the furthest with the tough margins in the feedlots. For the first time in many years, a significant number (44%) of these operations saw negative net farm income. While this is reasonable in the short term, these operations obviously can not withstand these losses in the long term. This is an extreme difference from just four to five years ago when we didn’t see a single operation with a negative net income.
In 2015 we started to see some costs of production come down slightly. For example, the total cost per acre for Irrigated Corn on Cash Rented Ground decreased almost $40 per acre. With that reduction, a tie for record high yield and most producers receiving a large ARC payment, there was an average profit. The profitability range was very wide with the high profit third of this farmer group making almost $300 per acre more than the low profit third. While income (yield and price) made up for half of the difference, the other $150 per acre came from cost control.
Top vs Bottom
One of the things the data shows us each year is that there is a wide range of profitability among producers. This is often hard for many people to grasp because they assume everyone is dealing with the same challenges. The reality is everyone deals with challenges their own way and we are seeing some big differences between those who have taken a proactive approach and the average operator.
| 2015 | 2002 | |
|---|---|---|
| Net Farm Income | $29,432 | $25,252 |
| Corn Price (Cash Sales) | $3.77 | $2.08 |
| Soybean Price (Cash Sales) | $9.46 | $4.64 |
| Per Acre Cost Irr. Corn Cash Rented Land | $791.45 | $361.11 |
| Family Living Expense | $91,991 | $36,764 |
| Total Debt | $1,030,673 | $413,537 |
| Debt-to-Asset Ratio | 28% | 39% |
| Working Capital to Gross Revenue | 28.1% | 17.2% |
| Accrual Gross Income | $954,821 | $395,303 |
| Crop Acres | 961 | 937 |
| Numbers represent average of farmers served by Nebraska Farm Business, Inc. | ||
For the past few years, we have worked more intensely with a few operations on a more focused financial management in a program call CFO. In general, it is actively managing their cash flow throughout the year and planning what will happen with their money rather than waiting until the end of the year when we look back to see what happened. As we were processing the individual data, it was noticed that these operation’s net farm income did not drop off as sharply as other operations. Since these are mainly crop operations, we looked at the average of the very small group of operations who are using an active cash flow vs the average crop operation. The operations using our CFO Service saw an average decline of 7% of net farm income vs the average crop operation seeing a 41% decline. Obviously there are many other variables, but the large difference seems to lean towards the benefits of actively managing the farming business rather than leaving accounting to the end of the year.
The accrual net farm income range was over $1.5 million. In 2014, the livestock operations took the top spots and this year swung all the way to the bottom.
Debt
Over the past few years we have been watching the amount of total debt climb among our farmer group (Figure 2). In 2015 we saw another overall increase to $1,030,675. (This reflects a much larger trend for farm debt, according to a May 12 Ag Credit Survey report from the Federal Reserve Bank of Kansas City. See Farm Debt Accumulating.)
While the growth has slowed there are a few new trends developing within the total debt. We are seeing a rapid decline in the health of the current position of many farms.
- Average working capital to gross income has dropped to under 30% on average for the first time since 2006.
- At the beginning of 2015, 12% of the farms in the NFBI database had negative working capital. By the end of the year, that number had doubled to 24%.
- At the same time, those sitting with more than 80% working capital to gross revenues only dropped from 20% to 18%, showing that those operations in good shape, stayed that way.
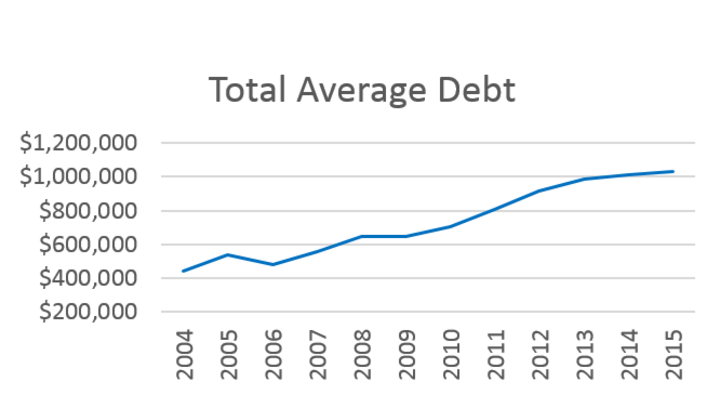
Figure 2. Total average debt from 2004-2015 for farmers served by Nebraska Farm Business, Inc.
This is the first major red flag to appear alerting producers to a major cash flow problem that without change will start to show in a total balance sheet problem as net worth erodes.
We have been watching all categories of debt increase, but one interesting change in 2015 was the rapid increase in long-term debt and a decrease in intermediate debt. Since we did not see a very large land purchase effect, it may mean that we are seeing more refinancing to improve the current position and leveraging the additional debt in the long term. This is a tool that will help many operations get readjusted for tough times, but if the cause of the problems has not been identified and corrected, it may simply be buying time for a bigger problem to surface.
Family Living
There is good news when it comes to family living expense as we saw the first major decrease in costs in 2015 (Figure 3). Out-of-pocket spending is down almost 8% from the high in 2013 to $91,991. Income taxes also dropped to $30,727. While these are encouraging to see, the combined accrual net farm income and non-farm wages received are only about $47,000. This shows why over 56% of the farms included in the average saw a negative net worth change. At the same time, the profitability of the past 10 years built a lot of net worth for most farms. Using some of this net worth is not a cause for extreme reaction, but it is a red flag that changes need to be made soon. Continued reduction in spending and/or increases in nonfarm income will be vital for many operations to survive the next few years.
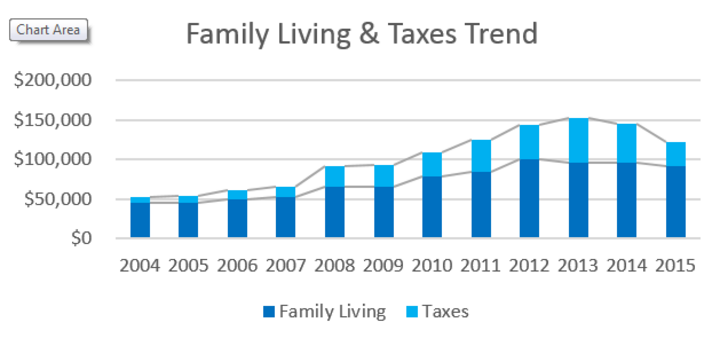
Figure 3. Change in family living expenses and taxes among Nebraska Farm Business, Inc. farmers from 2004 to 2015.
Summary
So have we returned to an old normal? In the general sense that we have returned to tight margins and cost control seems to be the difference between the farms that make money and those that don’t, yes, we have returned to an old normal. This return to normal comes with a higher risk. Farm size is bigger. Debt load is bigger. Non-farm costs are bigger. The data from 2015 shows us that some producers have recognized this and made adjustments to the way they do business. It also shows us that others haven’t.
