Defining Farm Income?
| Cash Flow | Taxable Income | |
|---|---|---|
| Feeder livestock purchase | Cash paid during the calendar year | Cost of the cattle sold during the year, regardless of when purchased. |
| Hedging activities | Includes margin calls/withdrawals | Includes a realized profit or loss |
| Coop equity | Not included | Included |
| Principle payments/capital purchases | Included | Depreciation only |
| Family living/Income tax/Non-farm capital purchases | Included | Not included |
There are many definitions of income for a farm operation and they’re all important to a successful farm.
- Taxable income is the amount that is recognized on a cash basis tax return, but it rarely is an accurate reflection of the earnings of the business.
- Cash flow is often used to show the business’s ability to meet all of its obligations, but it can be manipulated easily by selling additional grain or delaying expenses to make a 12-month cash flow look good.
- Accrual Basis Net Farm income is the best measurement of farm profitability, but it can often show a farm making money and still show a negative cash flow.
Each of these measures of income do work together. If an operation has a high accrual income, but tries to keep its taxable income low, its cash flow will likely not look good. If an operation shows a trend of negative accrual income, there is only a short time until the cash flow and taxable income burn through carryover inventories and become negative. It seems like the concept that accrual income is different than cash flow or cash basis taxable income is easy to grasp, but it’s often hard to correlate the differences between the latter two. The reality is cash flow and taxable income are calculated in very different ways. Table 1 shows some of the major differences between the two.
Tables 2 and 3, based on averages of Nebraska Farm Business Inc. (NFBI) operations across Nebraska, further illustrates these differences. In 2015, the average farm showed a positive cash flow of $463, but that would loosely equate to income subject to tax of over $120,000. To further the confusion, the average accrual net farm income was $29,432.
| Cash Income | $151,276 |
| Net Cash From Investing | – $202,139 |
| Net Cash From Financing | $51,326 |
| Net Cash Flow | $463 |
| Average Accrual Income | $29,432 |
| Cash Income | $151,276 |
| Asset Sales | + $31,711 |
| Capital Purchases * | – $97,616 |
| Non-Farm Income | + $36,087 |
| Total Income | $121,458 |
| *Assumes full write-off of all capital purchases | |
The Net Cash from Investing includes the assets sales and capital purchases included in the taxable income calculation, however, a few other things are not included in the taxable calculation. That includes the sale of non-farm assets (assuming they too wouldn’t be taxable) and the purchase of non-deductible assets such as farmland and non-farm assets.
The Net Cash from Financing includes the non-farm income that is included in the taxable income, but also includes net money borrowed, family living withdrawals, income and social security taxes, cash gifts and inheritances.
Page 20 of the 2015 Whole State Average Financial Data book, available from NFBI, contains more details.
| Total Income Subject to Tax | $121,458 |
|---|---|
| ½ Self-Employment Tax | –$3,791 |
| Health Insurance | $10,000 |
| Adjusted Gross Income | $107,667 |
| Standard Deduction | $12,600 |
| 4 Personal Exemptions | $16,000 |
| Taxable Income | $79,067 |
| Income Taxes | $11,355 |
| Self-Employment Tax | $7,582 |
Table 4 takes this one step further and shows the taxable income of this average operation. In order to calculate taxable income, a few assumptions were made. The first being that this was a married couple with two kids and the second being that they paid $10,000 per year for health insurance. With those assumptions, the calculated taxable income is close to the top of the 15% tax bracket for 2015. This would be a strategy that many operations have considered a good, acceptable tax strategy for many years.
So is it a “good tax plan” that puts an operation in a break-even cash flow? Of course the answer is “it depends,” but it shows that this average information is very close to representing real operations.
Disconnect Between Cash Flow and Taxable Income
Refer back to Table 1 where the big differences between cash flow and taxable income are listed. Those items that typically resolve themselves within a short time such as Feeder Livestock Purchase and Hedging Activities can be eliminated as significant contributors to the problem. Those that are typically relatively small dollar amounts such as Coop Equity and the non-deductible Retirement Contributions also can be disregarded. That leaves the things that really make a disconnect:
- The difference between the amounts invested in assets (principle payments and cash outlay for capital purchases) and the timing of depreciation
- The amount of cash spent on Family Living, Non-Farm Capital Purchases and Income and Social Security taxes.
Enhanced Depreciation: Friend or Foe

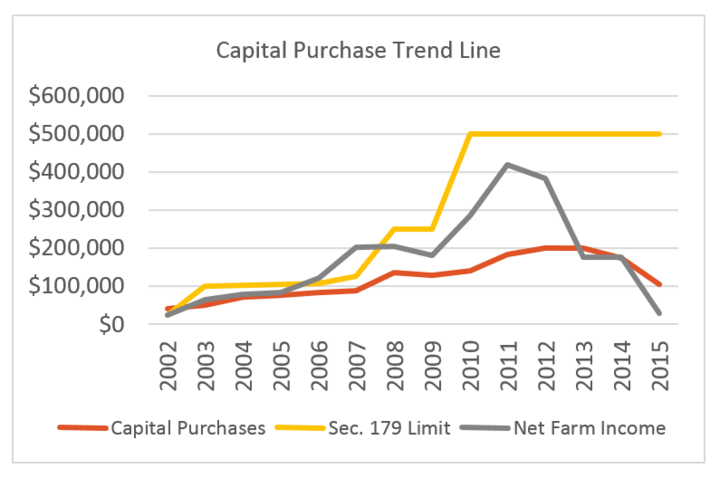
Tax law over the past 15 years has encouraged businesses of all sizes to spend money on capital assets as a way to spur the national economy. While much of the nation was seeing a sluggish economy at best, the agricultural industry (especially the cash grain segment) was seeing a “Super Cycle” with the highest profitably most producers have ever seen. The combination of high profitability and changes in income tax law combined for a perfect storm for many producers looking to improve machinery lines and reduce tax liabilities. Figure 1 shows Average Capital Purchases (not including land or non-farm assets) made by the operations included in the NFBI averages, the Average Accrual Net Farm Income, and the limit for Section 179 in each year from 2002 to 2015.
It’s hard to know whether it was the tax law or increased income that caused spending to increase, but we saw the average amount spent on deductible assets increase from $40,000 per year to a peak of over $200,000 per year in just 10 years. While the amount of purchases has dropped off since 2012, the average in 2015 was still over $100,000 — three times the 2015 average accrual income of $29,432. This was the third consecutive year that these purchases were larger than, or essentially equal too, the accrual net farm income. Some of the increase in spending was certainly needed to update the line of equipment that had been “just getting by” for many years, but it’s hard to find many operations that do not have equipment that exceeds their basic needs for getting the job done. That excessive spending in the name of tax savings doesn’t really make financial sense. Spending $100 to save $30 means $70 could have been added to working capital and saved for the future.

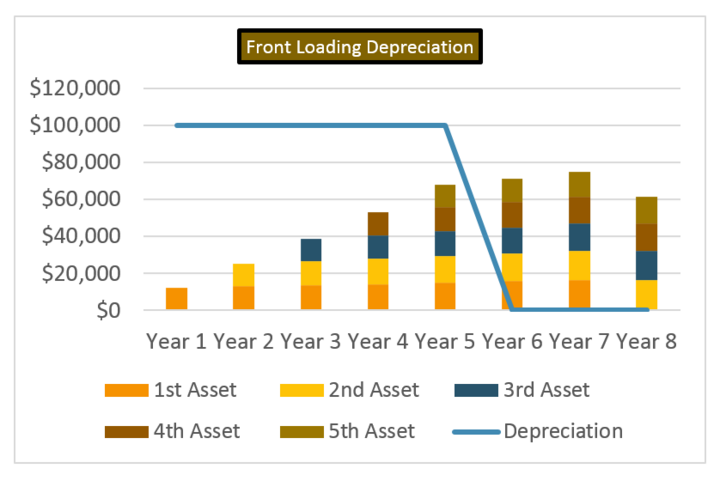
A bigger issue that creates the disconnect is using the enhanced depreciation (Section 179 and Bonus Depreciation) and financing the asset purchase. The principle payments on a typical amortized loan and the amount of depreciation on a “regular” schedule actually line up fairly close. This means that in any given year of a loan, the principle payment (which is not deductible) and the amount of deprecation deducted on the tax return are relatively close. This prevents a significant disconnect between the amount of cash out of the business on the cash flow and the amount of depreciation being taken on the taxable income. The use of Section 179 and Bonus to take the expense of the capital asset in the year of purchase rather than when the cash is leaving the operation has been widely used in the last 8 to 10 years.
Figure 2 shows a hypothetical example of buying a $100,000 asset in year 1, taking all the depreciation that year and only having to put cash out for a down payment. Year 2 comes along and another $100,000 expense would be needed for taxes so another asset is purchased and financed. Again only a small amount of cash is paid for that asset and a second payment is needed on the first year asset. This has been continuing for several years. Imagine that 2016 is year 6. There is now over $70,000 in principle payment commitments and no depreciation for tax purposes. The cash flow is going to show a disconnect of taxable income by over $70,000. While this example is hypothetical, there is a rapid increase in the amount of debt each operation is carrying and this is a real issue many operations will face this year.
Family Living and Taxes

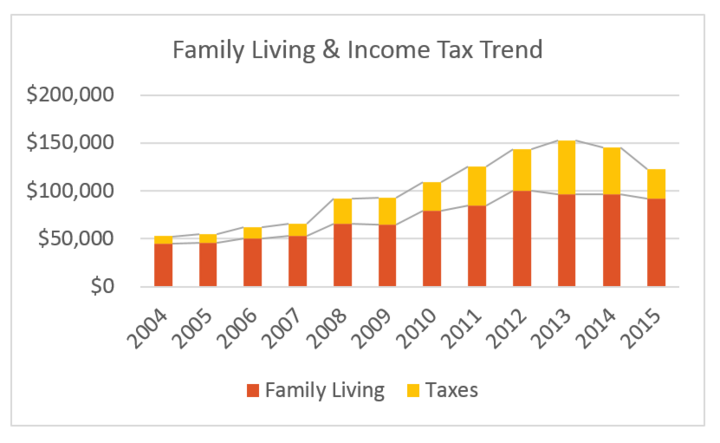
Over the past 10 years, the amount of money spent annually on family living and income taxes has grown dramatically. Prior to 2005, average family living stayed around $40,000, plus an additional $10,000 for income taxes. In 2015, family living was $92,000, with an additional $30,000 in income taxes. This increase in non-deductible costs has also contributed to a disconnect between cash flow and tax planning. Taxable income must increase as non-deductible costs increase.
To put things into perspective, a salary of $140,000 per year would be needed to have a take-home check of $92,000 per year. In addition, nothing is included in the $92,000 for principle on a mortgage or contributions to retirement accounts. Assuming 5% to retirement and a $1,000 per month principle payment on a mortgage, the living level of the average farmer would equate to someone making about $160,000 per year.
There are two separate issues with living expenses at this level.
- Is there enough profitability to support this level of spending?
- Is the operation recognizing enough taxable income to support this level of spending?
If there is not enough profit to support the high level of spending, net worth losses will start to stack up. This is a fundamental management problem. The other issue creates a “snowball” effect where the deferred tax liability can get out of control, leading to a large operating note at the end of the year and large carryover inventories. Consider the trend illustrated in Table 5.
| 2010 | 2011 | 2012 | 2013 | 2014 | 2015 | |
|---|---|---|---|---|---|---|
| Accrual Income | $50,000 | $75,000 | $100,000 | $150,000 | $75,000 | $15,000 |
| Taxable Income | $35,000 | $35,000 | $35,000 | $35,000 | $35,000 | $35,000 |
| Family Living | $40,000 | $45,000 | $50,000 | $55,000 | $60,000 | $65,000 |
| Operating Note | $5,000 | $15,000 | $30,000 | $50,000 | $75,000 | $105,000 |
In 2010, there was an accrual income of $50,000 but only $35,000 was recognized as taxable income. In order to have cash basis income be $35,000, $15,000 of the grain produced in 2010 would not be sold until 2011. The family had already spent $40,000 on family living so they would need to have an operating note at the end of the year of $5,000.
In 2011, they have the additional $15,000 of grain from 2010 and make $75,000 for a total income of $90,000. They still only want to recognize $35,000, so $55,000 of 2011’s grain is not sold in 2011, but in 2012. This year, their family living needs increased to $45,000, $10,000 more than they recognized so they’d need operating proceeds of $15,000 at the end of the year.
It doesn’t take long to see how this rolls into a “snowball” of large proportions. The only way to unwind this is to increase taxable income and/or cut family living costs. Accrual basis losses may start to cut into inventory, but losses will only make the operating note increase at a faster rate.
Working TogetherAs different as all these approaches are, a good farm manager will work all of them together.
- A good tax plan needs to take into account the accrual income and cash flow needs of an operation to ensure that a huge snowball isn’t created or it will take a long time to get rid of.
- A good cash flow plan takes into account the tax consequences of generating that much income and calculates an accrual basis income to know good long-term progress is being made.
- Accrual income shows the true earnings of the business, but the timing of recognizing income is sometimes just as important as earning it.
For related information see the Farm Management, Economics and Marketing section of CropWatch.unl.edu.
