Corn Sweat is a Marketing Term
The term corn sweat is being used a lot right now to talk about the excessive humidity that we get at times in the summer in the central U.S. But corn sweat is really just the media's way of describing evapotranspiration (ET). In other words, it's a clever marketing term.
ET is not limited to row crops either; most of the plants we are familiar with have stomata and transpire water vapor when there is daylight and they have water in the soil to transpire. But our row crops, especially corn, can transpire significant amounts of water vapor into the lower part of the atmosphere during the summer months.
Can't Blame All Humidity on the Corn
Much of our humidity in the summer is a result of us tending to have predominant southerly flow in the summer, which brings up warm, moist air from the Gulf. We also have fully leafed-out trees and other plants that transpire, which add extra water vapor to the atmosphere. Warmer air can hold more water vapor (see Clausius Clapeyron rule). So, for a variety of meteorological and biological reasons, our dewpoints would still be modestly high in the summer in this region of the country even if we had never plowed up the prairies and planted corn.
Suitable Soils
Before we get into the corn's ET rates, let's take a look first at the reason corn can grow quite successfully in the Corn Belt.
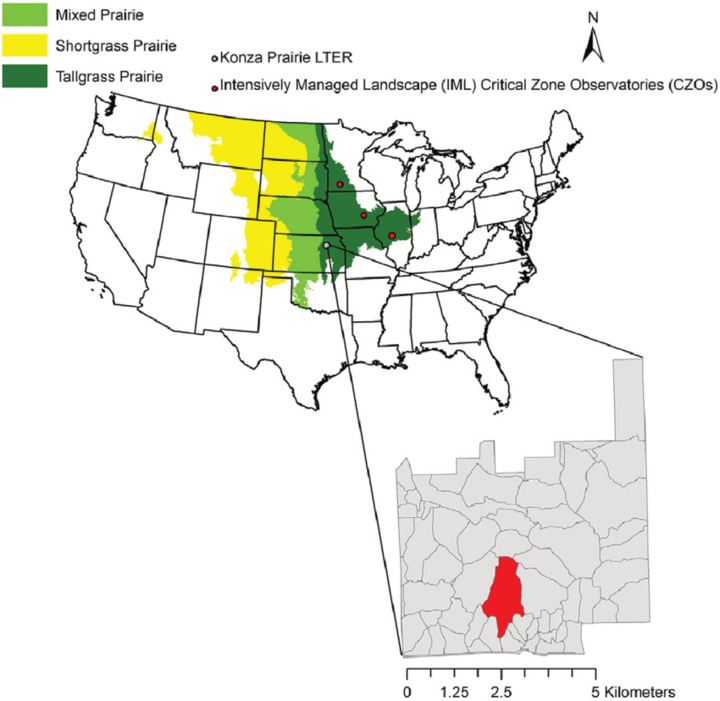
Areas in the darker green (Figure 1) were native tallgrass prairie prior to European settlement and had deep, rich soil that could hold a lot of water. As you go further west in the Plains, the grasses get shorter due to less precipitation and/or shorter growing seasons. But the areas with the richer soil are also ideal for row crops like corn. The confluence of rich soil and relatively consistent precipitation without too much excessive heat has made states like Iowa and most of Illinois ideal places for corn. So, part of the reason we get extra humidity is the combination of ecological and geological fate coming together to produce some of the richest soils in the world that are perfect for corn.
Corn Sweat Not Equitable
Figure 2 below from Kansas State University shows that the ET from corn tends to peak in July and early August, in the weeks after tasseling.
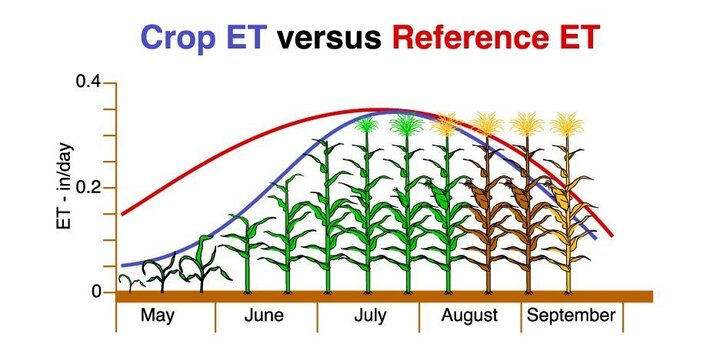
Earlier in the season when corn is in its early development stage, ET is much less than it is during the tasseling to milk stages. And as we start winding down the summer, the corn crop starts needing less water and thus is transpiring less. But during the middle of the summer when the corn is going through its reproductive stage, it needs and will use a lot of water. This also conveniently happens when we are climatologically at our peak for temperature, which thanks to Clasius-Clapeyron, means that the atmosphere can hold that extra water vapor and our surface dewpoints can be very high.
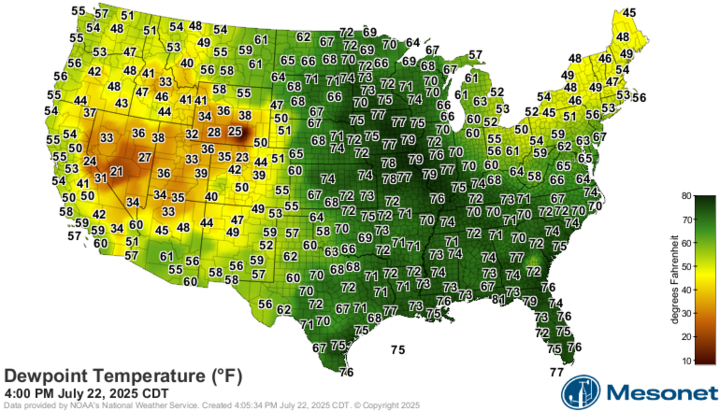
Thus, we tend to have our highest dewpoints in the back half of July and the first half of August when corn ET is at a peak. Soybean can have higher ET rates in August than earlier in the summer, so sometimes the soybean can help offset the drop in corn ET. Regardless, if you want to blame the corn for a humid day in May or September, you are probably blaming the wrong source. But during this time of year, the blame is earned. As of current writing, most of the western half of the Corn Belt has dewpoints in the 70s, almost pushing 80 in parts of Iowa, Missouri and Illinois.
Drought Makes a Difference
The higher ET rates are a sign that the crops are healthy and able to transpire water. When corn (like other plants) gets water stressed, its protective mechanism is to close its stomata (leaf roll) to preserve soil moisture. When soil moisture gets deficient, the stomata take a very long break during the day. They are the business that is open for an hour in the morning and an hour late in the day so plan accordingly. If this persists for days and weeks, photosynthesis is minimized, and the crop yields poorly or fails entirely.
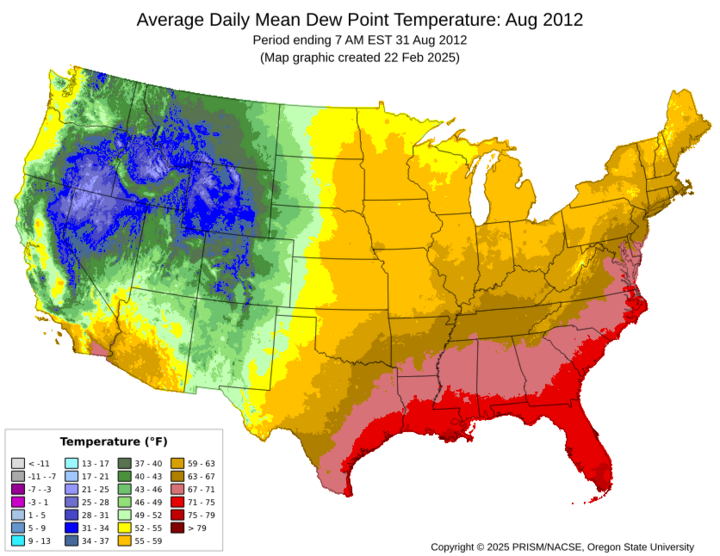
In years where we see widespread drought in the Midwest, the dewpoints tend to be much lower because of the reduced ET. Figure 3 shows a good example of this from August 2012, when a large portion of the region was in severe drought or worse. There were a lot of hot days, partly because it's easier to heat up dry air and dry soil. But the late season heat that year was more "comfortable" because the dewpoints were in the 50s and low 60s instead of 75 in places like eastern Nebraska and Iowa.