Key Takeaways
Stand counts are critical now: Accurate stand counts support timely replanting, nitrogen adjustments, and planter performance checks — all to protect yield.
Choose a method that fits your time and tools: Use the 1/1000th acre method, stick method, credit card spacing, or drone imagery with analysis tools.
Technology can help: Mobile apps and built-in phone measurement tools can streamline in-field calculations.
As planting progress approaches 100% and crop emergence surpasses 50%, assessing field plant populations is critical and and should throughout the season, especially if severe weather such as hail reduces stand counts. The evaluation of stand count is an important prerequisite for maximizing yields of corn, soybean and sorghum.
An adequate plant stand will maximize the capture of solar radiation and therefore photosynthesis, especially during the critical period for yield determination.
An accurate stand count also helps identify areas of the field with poor emergence or gaps due to inaccuracies in the planter or soil crusting issues. Identifying these areas early allows timely replanting or management decisions to minimize yield loss and have an efficient use of inputs in those areas for the rest of the season.
This article examines various methods for conducting and assessing corn, sorghum and soybean stand count in the field, whether manually or using technologies such as drones.
How to Conduct a Stand Count in the Field
1/1000th Acre Method
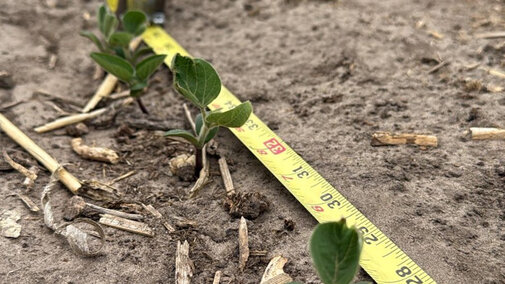
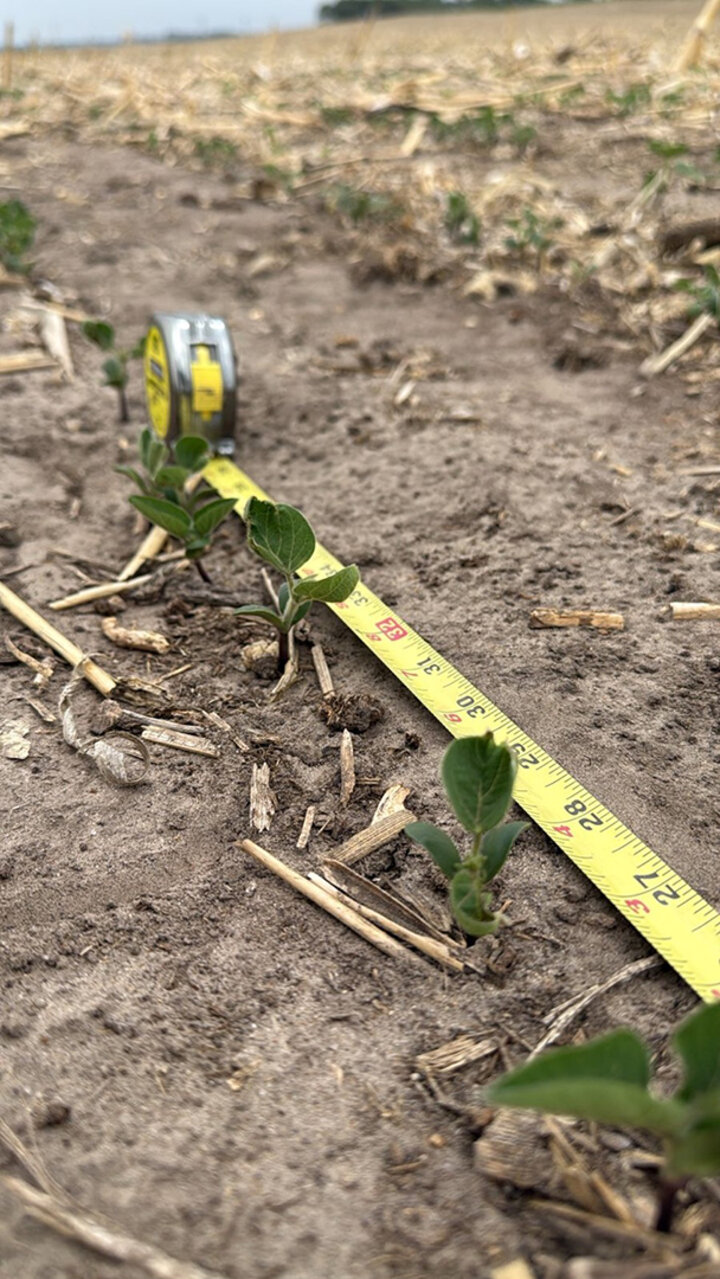
This method is used to assess stand count in row crops like corn, sorghum and soybean. In this case, we measure a row length equal to 1/1000th of an acre based on row spacing. For example, if row spacing in corn is 30 inches, then we need to count the number of plants in 17 feet and 5 inches of a row. To have a good representation of the field, count the number of plants from two adjacent lines, repeat at four to five different spots, and average the results (2 rows x 4 spots = 8 1/1,000th-acre spots to average). The number obtained multiplied by 1,000 will be the final plant population of the field.
Row width | Length of Single Row to Equal 1/1,000th of an Acre |
|---|---|
7.5 | 69’8” |
10 | 52’3” |
15 | 34’10” |
20 | 26’2” |
30 | 17’5” |
Stick Method
While the 1/1000th acre would provide a very accurate stand count, it also requires a lot of time. An alternative for a quick, but still robust stand count, is to use a pre-measured wooden stick or PVC tube of 4 feet for corn and sorghum, and 2 feet for soybean. In the field, plant spacing may not always be consistent, so try to find a representative spot and place the stick between two plants on each side to ensure a precise count. Walk the field, place the 4-foot stick along a row, and count the number of plants. Then use the table below to come up with the approximate plant population. An extremely low population (13,100) can be found in dryland cropping systems in western Nebraska or caused by stand-reducing abiotic injury (e.g., hail). Then use the tables below to estimate the plant population per acre for corn, sorghum and soybean.
Plants in a 4-foot length | Plant population for 20-inch row width | Plant population for 30-inch row width |
3 | 20,000 | 13,000 |
4 | 26,000 | 17,000 |
5 | 33,000 | 22,000 |
6 | 39,000 | 26,000 |
7 | 46,000 | 31,000 |
8 | - | 35,000 |
9 | - | 39,000 |
10 | - | 44,000 |
*All values are rounded to the nearest 1,000 plants per acre.
Plants in a 4-foot length | Plant population for 7.5-inch row width | Plant population for 10-inch row width | Plant population for 15-inch row width | Plant population for 20-inch row width | Plant population for 30-inch row width |
2 | 35,000 | - | - | - | - |
3 | 52,000 | 39,000 | - | - | - |
4 | 70,000 | 52,000 | 35,000 | - | - |
5 | 87,000 | 65,000 | 44,000 | 33,000 | - |
6 | - | 78,000 | 52,000 | 39,000 | - |
7 | - | 92,000 | 61,000 | 46,000 | - |
8 | - | - | 70,000 | 52,000 | 35,000 |
9 | - | - | 78,000 | 59,000 | 39,000 |
10 | - | - | 87,000 | 65,000 | 44,000 |
11 | - | - | - | 71,000 | 48,000 |
12 | - | - | - | 78,000 | 52,000 |
13 | - | - | - | 85,000 | 57,000 |
14 | - | - | - | 92,000 | 61,000 |
15 | - | - | - | - | 65,000 |
16 | - | - | - | - | 70,000 |
17 | - | - | - | - | 74,000 |
18 | - | - | - | - | 78,000 |
19 | - | - | - | - | 83,000 |
20 | - | - | - | - | 87,000 |
*All values are rounded to the nearest 1,000 plants per acre.
Plants in a 2-foot length | Plant population for 7.5-inch row width | Plant population for 10-inch row width | Plant population for 15-inch row width | Plant population for 20-inch row width | Plant population for 30-inch row width |
2 | 70,000 | - | - | - | - |
3 | 105,000 | 78,000 | - | - | - |
4 | 139,000 | 105,000 | 70,000 | - | - |
5 | 174 ,000 | 131,000 | 87,000 | - | - |
6 | - | 157,000 | 105,000 | 78,000 | - |
7 | - | 184,000 | 122,000 | 91,000 | - |
8 | - | - | 139,000 | 105,000 | - |
9 | - | - | 157,000 | 118,000 | 78,000 |
10 | - | - | 174,000 | 131,000 | 87,000 |
11 | - | - | - | 144,000 | 96,000 |
12 | - | - | - | 157,000 | 105,000 |
13 | - | - | - | 170,000 | 113,000 |
15 | - | - | - | - | 131,000 |
17 | - | - | - | - | 148,000 |
19 | - | - | - | - | 166,000 |
21 | - | - | - | - | 183,000 |
*All values are rounded to the nearest 1,000 plants per acre.
The Hoop Method
This method is ideal for drilled crops, narrow rows or situations where rows are difficult to distinguish, especially for soybean. Determining your final soybean population is easy with a hula hoop. It provides an accurate way to evaluate drilled or narrow-row soybean stands.
Randomly throw (or roll) the hoop into the field and count the number of soybean plants inside the hoop. Using the following table, multiply the number of soybean plants by the multiplication factor that corresponds to the size of the hula hoop. This gives the soybean population per acre. Do this at least 10 times per field.
For example, when using a 39-inch hula hoop, if you count 34 soybean plants, multiply 34 by 5,264 (the multiplication factor). This yields approximately 179,000 plants per acre.
| Hoop Inside Diameter (inches) | 21 | 24 | 26 | 28 | 30 | 33 | 36 | 39 |
| Multiplication factors corresponding to the hoop diameters above | 18,119 | 13,873 | 11,820 | 10,192 | 8,878 | 7,338 | 6,166 | 5,264 |
| Number of plants in a Hoop | Plant Populations | |||||||
6 | 109,000 | - | - | - | - | - | - | - |
7 | 127,000 | - | - | - | - | - | - | - |
8 | 145,000 | 111,000 | - | - | - | - | - | - |
10 | 181,000 | 139,000 | 118,000 | 101,000 | - | - | - | - |
12 | - | 166,000 | 142,000 | 122,000 | 107,000 | - | - | - |
14 | - | 194,000 | 165,000 | 143,000 | 124,000 | - | - | - |
16 | - | - | 189,000 | 163,000 | 142,000 | 117,000 | - | - |
18 | - | - | - | 183,000 | 160,000 | 132,000 | 111,000 | - |
20 | - | - | - | - | 178,000 | 147,000 | 123,000 | - |
22 | - | - | - | - | - | 161,000 | 136,000 | 116,000 |
24 | - | - | - | - | - | 176,000 | 148,000 | 126,000 |
26 | - | - | - | - | - | - | 160,000 | 137,000 |
28 | - | - | - | - | - | - | 173,000 | 147,000 |
30 | - | - | - | - | - | - | - | 158,000 |
32 | - | - | - | - | - | - | - | 168,000 |
34 | - | - | - | - | - | - | - | 179,000 |
*All values are rounded to the nearest 1,000 plants per acre.
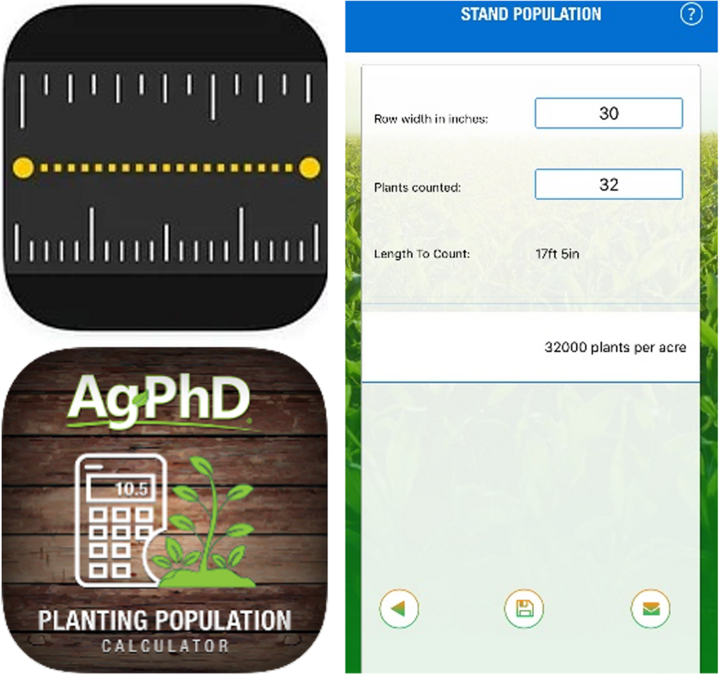
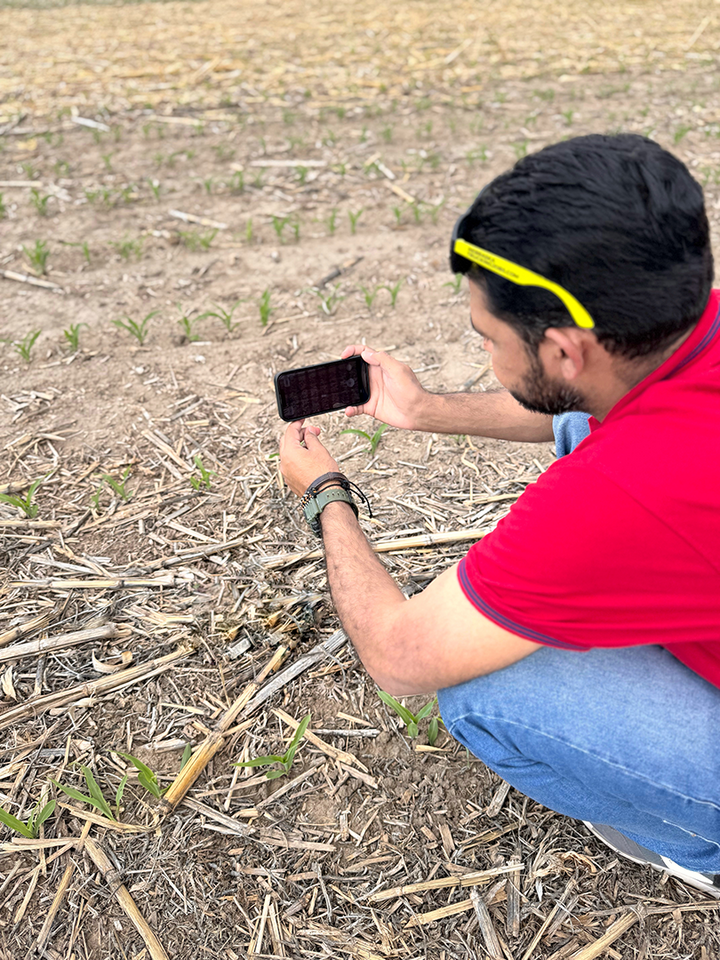
Mobile Application Tools
To facilitate measurements for either method mentioned above, one can use a smartphone to measure distances in the field. For example, iPhone has a built-in application called “Measure”.
Also, there is a mobile application called Ag PHD Planting Population Calculator, available for iOS and Android. When you open the app and select the tab for stand population, it will require an input of the row width in inches, then the app itself will calculate the area of one line in feet to count the number of plants. After adding the number of plants of that row, it will automatically count the number of plants per acre.
The figure shows the row width of 30 inches for corn, and the number of plants counted that was 32 in a length of 17 feet 5 inches, and a total number of plants per acre was calculated as 32,000.
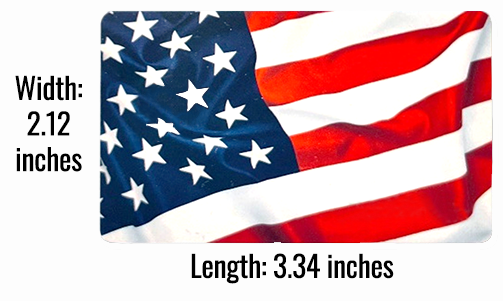
Using A Debit/Credit Card
This method can only be used to estimate the stand count while walking the field quickly — avoid field edges or obvious problem areas. A credit/debit card can be used to measure the distance between plants and, therefore, estimate the plant population. A standard credit/debit card measures 3.34 inches in length on the long edge and 2.12 inches in width (short edge). The plant population according to the distance between plants is shown in the following table.
Crop | Row width (inches) | Plant population depends on the number of cards spaced between two plants | ||
|
| 2 card lengths (6.69 inches) | 2.5 card lengths (8.35 inches) | 3 card lengths (10.0 inches) |
Corn | 20 | 47,000 | 38,000 | 31,000 |
30 | 31,000 | 25,000 | 21,000 | |
|
| 1 card width (2.12 inches) | 2 card widths (4.25 inches) | 3 card widths (6.37 inches) |
Soybean | 7.5 | - | 197,000 | 131,000 |
10 | - | 148,000 | 99,000 | |
15 | 197,000 | 98,000 | - | |
20 | 148,000 | - | - | |
30 | 98,000 | - | - | |
|
| 2 card widths (4.24 inches) | 4 card widths (8.48 inches) | 5 card widths (10.6 inches) |
Sorghum
| 7.5 | - | 99,000 | 79,000 |
10 | - | 74,000 | 59,000 | |
15 | 99,000 | 49,000 | 39,000 | |
20 | 74,000 | - | - | |
30 | 49,000 | - | - | |
*All values are rounded to the nearest 1,000 plants per acre.
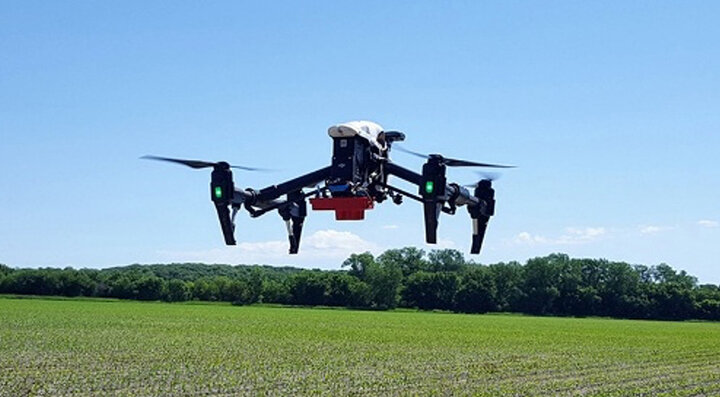
Drone
Drones with high-resolution cameras and appropriate image processing software can be used for accurate data collection and analysis to quantify the stand count by following these steps.
Step 1: First, select a representative area and conduct a drone flight with a high-resolution RGB camera (greater than 20 MP) capturing 2-5 cm/pixel imagery, ensuring 80% front lap and 70% side lap for complete coverage. The drone should fly at a height of 20 feet under a clear sky between noon and 2 p.m. to avoid shadow effects.
Step 2: After completing the flight, process the collected images using software such as Pix4D, DroneDeploy, or Agisoft Metashape to create a single georeferenced image (orthomosaic) of the entire field. Apply image enhancement techniques to improve plant visibility and use vegetation indices to differentiate between plant and soil.
Step 3: Finally, use applications like ArcGIS Pro, QGIS, or precision software like Climate FieldView or Pix4D Fields with machine learning tools like Agremo or PlantCV to quantify stand count by identifying individual plants and rows in the processed images. These tools help to measure stand counts, aiding in making replanting decisions. For more information, see the article “Evaluation of Digital Ag Tools on Soybean Stand Count”.
Why Does Stand Count Matter?
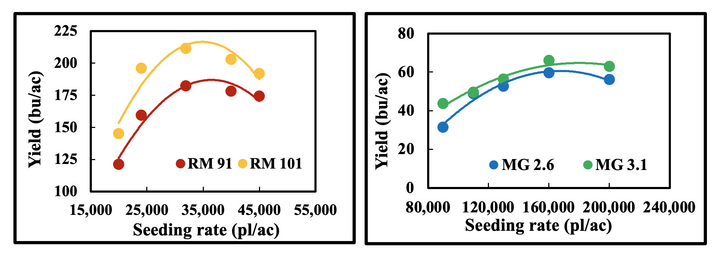
Sub-optimal corn stand count can reduce targeted yield (Figure 1). Therefore, nitrogen fertilizer input should be readjusted. To do this, the UNL Corn N Calculator can be used by modifying the yield goal based on the current stand count.
Extremely low corn and soybean stands may need replanting. If that’s the case, check replanting considerations for corn and soybean.
Sorghum stand count is important because sorghum can tolerate a wider range of populations. However, extremely low or highly uneven stands can significantly reduce yields. Monitoring stand count in sorghum also helps guide thinning decisions in fields where emergence was uneven due to crusting, variable seed depth, or pest pressure.
Additionally, the difference between the seeding rate and the stand count provides an estimate of planting efficiency, which can be converted to the cost of seeds. This efficiency can help identify possible planter regulations, seed treatment needs or other crop management practices that can be improved in the following season to save seed costs.
Try to Determine the Cause of a Poor Stand
If your stand count falls well below the planted rate, do not rush the planter back into the field without first diagnosing the root cause. Dig in the gaps and evaluate:
- Planter Malfunctions: Check for ungerminated seeds at irregular depths, indicating poor downforce or row-unit bounce. Hair-pinning of residue can also cause poor seed-to-soil contact.
- Environmental Stress: Was there heavy rain causing soil crusting? Did cold imbibitional chilling occur due to a cold snap within 48 hours of planting? Look for "corkscrewed" mesocotyls.
- Pest and Disease Pressure: Look for hollowed-out seeds (wireworms or seedcorn maggots) or soft, rotted tissues indicating damping-off (pythium or phytophthora) in wet soils.
- Chemical Injury: Look for swollen roots or burned tissues that might indicate fertilizer salt burn or pre-emergence herbicide carryover.
Is a Replant Needed?
A reduced stand does not automatically mean replanting will be profitable, since many crops can partially compensate after foliage losses.
Follow this systematic approach to evaluate whether replanting is likely to improve returns:
- Wait and Evaluate: If the damage is from hail or frost, wait five to seven days before evaluating. Plants often recover if the growing point remains healthy.
- Determine Yield Potential of Current Stand: Soybean compensates through more branches, additional pods per plant, more seeds per pod, and increased seed weight; early-planted soybean with stands as low as 50,000 plants/acre can still produce competitive yields. Similarly, corn compensates through larger ear size when gaps are uniform; non-uniform gaps (large skips) reduce this compensation ability significantly, while sorghum can compensate through increased tillering, more heads per plant, and higher seed weight per head.
- Compare with Replant Yield Potential: Assemble three key pieces of data before comparing: the original planting date and stand, the earliest possible replanting date and expected stand, and the yield loss associated with delayed planting. Later planting dates carry an inherent yield penalty, so a replanted crop at a lower population on a later date may still underperform the damaged stand.
- Calculate Costs: Factor in the cost of replant seed, fuel, labor and machinery wear.
- Check Herbicide Restrictions: Verify if the pre-emergence herbicides already applied allow for replanting the desired crop without causing chemical injury.
- Check Crop Insurance Requirements: Many crop insurance policies have specific waiting periods and documentation requirements before a replant claim is valid. Always contact your crop insurance provider before making any replant action.
