Key Takeaways
Stand counts are critical now: Accurate stand counts support timely replanting, nitrogen adjustments, and planter performance checks — all to protect yield.
Choose a method that fits your time and tools: Use the 1/1000th acre method, stick method, credit card spacing, or drone imagery with analysis tools.
Technology can help: Mobile apps and built-in phone measurement tools can streamline in-field calculations.
As planting progress approaches 100% and crop emergence surpasses 50%, assessment of field plant populations is critical and should continue if severe weather (i.e. hail) changes populations. The evaluation of stand count is an important prerequisite for maximizing yields of corn and soybean.
An adequate plant stand will maximize the capture of solar radiation and therefore photosynthesis, especially during the critical period for yield determination. An accurate stand count also helps identify areas of the field with poor emergence or gaps due to inaccuracies in the planter or soil crusting issues, enabling timely replanting or management decisions to minimize yield loss and have an efficient use of inputs in those areas for the rest of the season.
This article examines various methods for conducting and assessing corn and soybean stand count in the field, whether manually or using new technology such as drones.
How to Conduct a Stand Count in the Field
1/1000th Acre Method
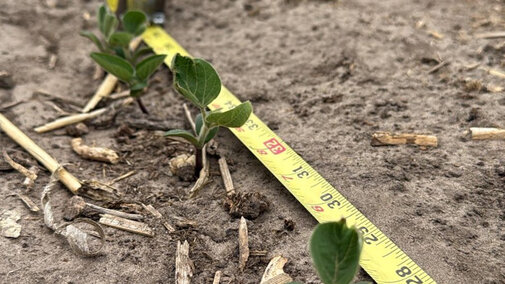
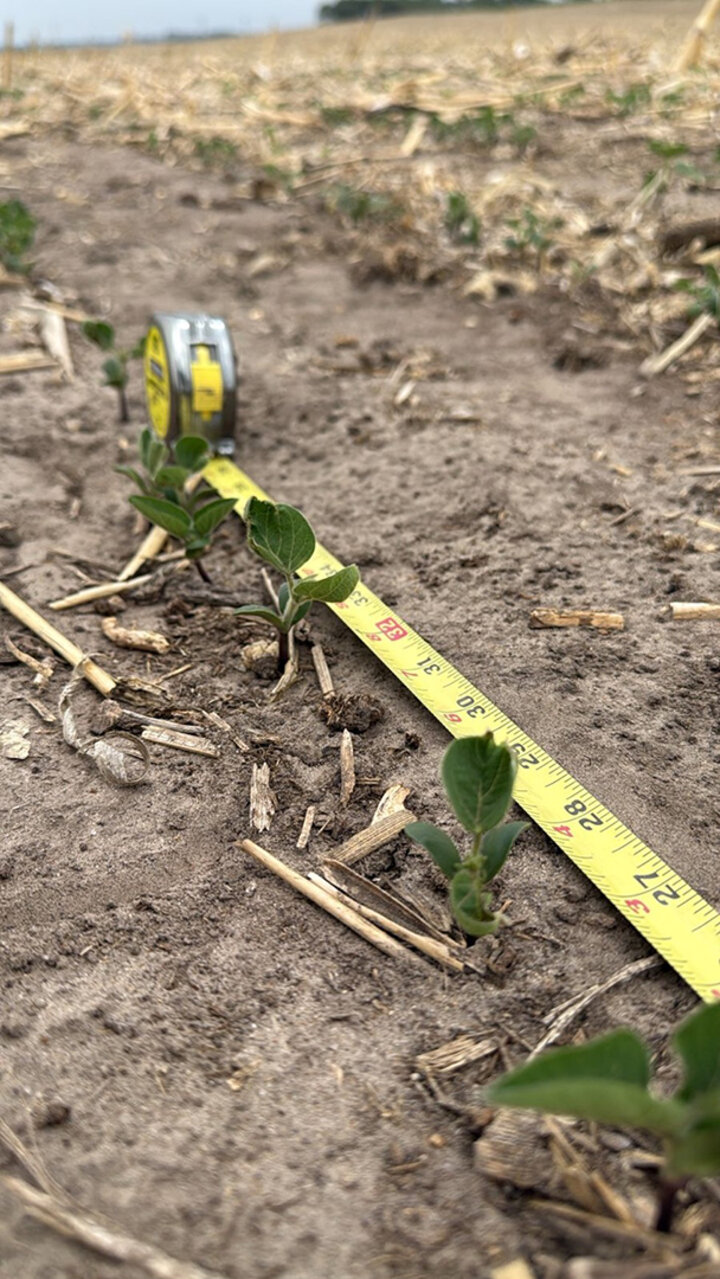
This method is used to assess stand count in row crops like corn and soybean. In this case, we measure a row length equal to 1/1000th of an acre based on row spacing. For example, if row spacing in corn is 30 inches, then we need to count the number of plants in 17 feet and 5 inches of a row. To have a good representation of the field, count the number of plants from two adjacent lines, repeat at four to five different spots, and average the results. The number obtained multiplied by 1,000 will be the final plant population of the field.
Row width | Length of Single Row to Equal 1/1,000th of an Acre |
|---|---|
7.5 | 69’8” |
10 | 52’3” |
15 | 34’10” |
20 | 26’2” |
30 | 17’5” |
Plants in a 4 ft length | Plant population for 20-inch row width | Plant population for 30-inch row width |
3 | 19.6K | 13.1K |
4 | 26.1K | 17.4K |
5 | 32.6K | 21.8K |
6 | 39.1K | 26.1K |
7 | 44.8K | 30.4K |
8 | 52.1K | 34.8K |
9 | 58.6K | 39.2K |
10 | 65.3K | 43.5K |
Stick Method
While the 1/1000th acre would provide a very accurate stand count, it also requires a lot of time. An alternative for a quick, but still robust stand count, is to use a pre-measured wooden stick or PVC tube of 4 feet for corn and 2 feet for soybean. Walk the field, place the 4-foot stick along a row, and count the number of plants. Then use the table below to come up with the approximate plant population.
Plants in a 2 ft length | Plant population for 7.5-inch row width | Plant population for 10-inch row width | Plant population for 15-inch row width | Plant population for 20-inch row width | Plant population for 30-inch row width |
2 | 70K |
|
|
|
|
3 | 105K | 79K |
|
|
|
4 | 139K | 105K | 70K |
|
|
5 | 174K | 131K | 87K |
|
|
6 | 209K | 157K | 105K | 78K |
|
7 | 244K | 184K | 122K | 92K |
|
8 |
| 210K | 140K | 105K |
|
9 |
| 236K | 157K | 118K | 78K |
10 |
|
| 175K | 131K | 87K |
11 |
|
| 192K | 144K | 96K |
12 |
|
| 210K | 157K | 105K |
13 |
|
| 227K | 170K | 113K |
15 |
|
|
| 196K | 131K |
17 |
|
|
| 222K | 148K |
19 |
|
|
|
| 166K |
21 |
|
|
|
| 183K |
22 |
|
|
|
| 192K |
23 |
|
|
|
| 200K |
24 |
|
|
|
| 209K |
Mobile Application Tools
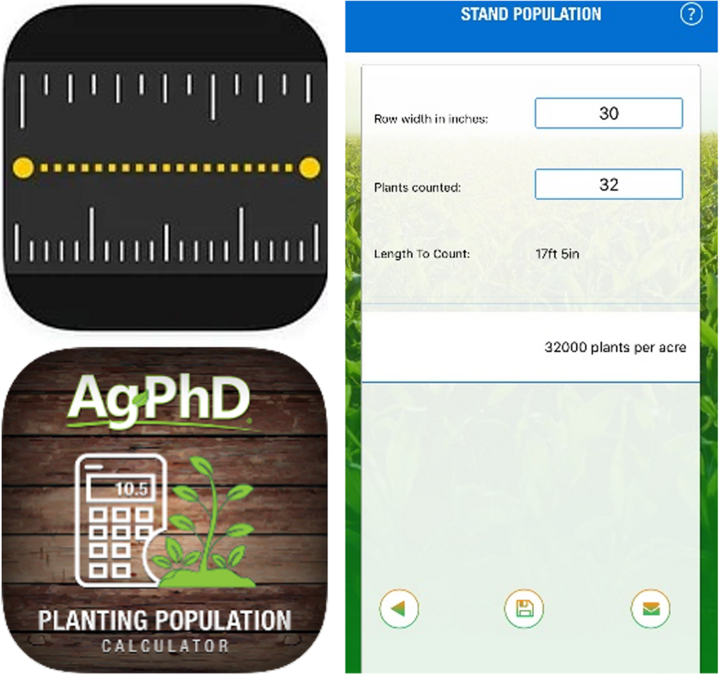
To facilitate measurements for any of the two methods mentioned above, one can use a smartphone to measure distances in the field. For example, iPhone has a built-in application called “Measure”.
Also, there is a mobile application called Ag PHD Planting Population Calculator, available for iOS and Android. When you open the app and select the tab for stand population, it will require an input of the row width in inches, then the app itself will calculate the area of one line in feet to count the number of plants. After adding the number of plants of that row, it will automatically count the number of plants per acre.
The figure shows the row width of 30 inches for corn, and the number of plants counted that was 32 in a length of 17 feet 5 inches, and a total number of plants per acre was calculated as 32,000.

Using Your Business or Debit/Credit Card
This method can only be used to estimate the stand count while walking the field quickly. A business/debit card can be used to measure the distance between plants and, therefore, estimate the plant population. A standard credit/debit card measures 3.34 inches in length on the long edge and 2.12 inches in width (short edge). The plant population according to the distance between plants is shown in the following table.
Crop | Row width (inches) | Plant population depends on the number of cards spaced between two plants | ||
|---|---|---|---|---|
| 2 card lengths | 3 card lengths | ||
Corn | 20 |
| 46.9K | 31.3K |
30 |
| 31.2K | 20.8K | |
|
| 1 card width | 2 card widths | 3 card widths |
Soybean | 7.5 |
| 196K | 131K |
10 |
| 148K | 98.4K | |
15 | 197K | 98.4K |
| |
20 | 148K |
|
| |
30 | 98.4K |
|
| |
Drone
Drones with high-resolution cameras and appropriate image processing software can be used for accurate data collection and analysis to quantify the stand count by following these steps.
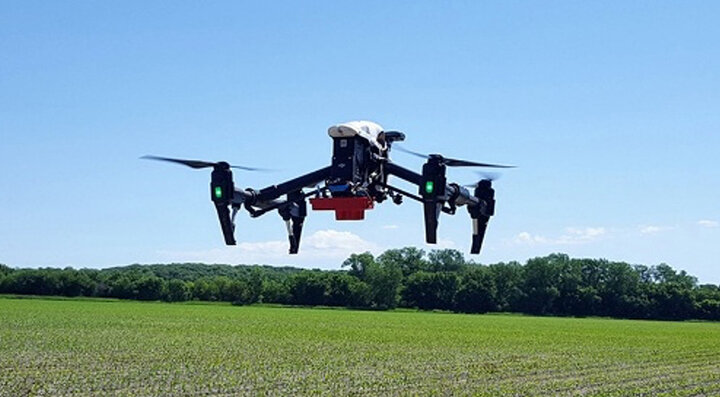
Step 1: First, select a representative area and conduct a drone flight with a high-resolution RGB camera (+20 MP) capturing 2-5 cm/pixel imagery, ensuring 80% frontlap and 70% sidelap for complete coverage. The drone should fly at a height of 20 feet under a clear sky at around 12 to 2 p.m. to avoid shadow effects.
Step 2: After completing the flight, process collected images by using specific software like Pix4D, DroneDeploy, or Agrisoft Metashape to create a single georeferenced image (orthomosaic) of the entire field. Apply image enhancement techniques to improve plant visibility and use vegetation indices to differentiate between plant and soil.
Step 3: Finally, use applications like ArcGIS Pro, QGIS, or precision software like Climate FieldView or Pix4D Fields with machine learning tools like Agremo or PlantCV to quantify stand count by identifying individual plants and rows in the processed images. These tools help to measure stand counts, aiding in making replanting decisions. For more information, see the article “Evaluation of Digital Ag Tools on Soybean Stand Count”.
Why Does the Stand Count Matter?
Sub-optimal corn stand count can reduce targeted yield (Figure 1). Therefore, nitrogen fertilizer input should be readjusted. To do this, the UNL Corn N Calculator can be used by modifying the yield goal based on the current stand count.
Extremely low corn and soybean stands may need replanting. If that’s the case, check replanting considerations for corn and soybean.
Additionally, the difference between the seeding rate and the stand count will provide an estimate of the planting efficiency, which can be converted to the cost of seeds. This efficiency can help identify possible planter regulations, seed treatment needs or other crop management practices that can be improved in the following season to save seed costs.

