Key Takeaways
Summer cover crop biomass is highly dependent on rainfall, especially during establishment; wheat harvest often limits available soil moisture.
Grasses produced the highest biomass and had the highest C:N ratios, offering durable residue but slower decomposition.
Legumes had the lowest C:N ratios, supporting faster nutrient cycling and nitrogen contribution, though with lower biomass.
Mixtures balanced productivity and nutrient cycling, offering consistent performance across variable conditions.
Background
There are many benefits reported by farmers when they plant cover crops, including planting earlier during wet years, saving on production costs, and improving soil health (CTIC Survey 2020). However, no single species can provide all the advantages on their own, which is why multi-species mixtures have gained popularity; they have the ability to combine multiple benefits (Florence and Mcguire 2020). Yet questions remain about how well these mixtures perform compared to single-species plantings and how individual varieties respond to changing conditions from year to year.
Summer cover crops are particularly valuable when planted after small grains like winter wheat or oats because they take advantage of a longer growing window compared to fall-planted cover crops. This extended window allows for greater flexibility in species and variety selection, helping farmers align their cover crop choices with specific goals. Some species are better suited for producing large amounts of biomass, while others excel at suppressing weeds or improving soil nitrogen (Wayman et al. 2015).
For example, grasses are highly effective at scavenging nutrients and providing forage, whereas summer legumes fix nitrogen, contributing to soil fertility (Blanco-Canqui et al. 2012). By selecting species and mixtures based on their functional traits, we can better optimize cover crop performance and maximize their benefits.
As part of the Cover Crop Initiative experiments in Nebraska, we evaluated the establishment and biomass production of 17 cover crop varieties and five cover crop mixtures over three experimental years in eastern Nebraska. This multi-year study highlights how environmental variability influences summer cover crop performance and demonstrates the importance of selecting species capable of adapting to different conditions. By understanding these year-to-year differences, we can improve cover crop recommendations to maximize biomass production and soil benefits despite unpredictable growing seasons.
Site Description and Environment
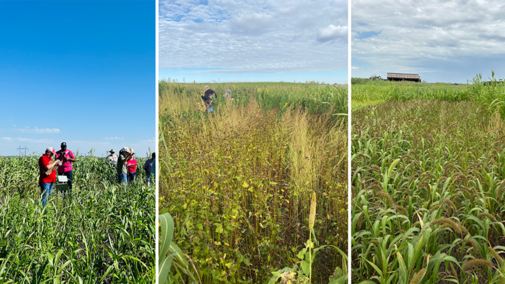
The study took place at Rogers Memorial Farm in Lancaster County, Nebraska (40°50'39.4"N, 96°28'06.5"W; elevation 1,200 feet) during the summers of 2022, 2023 and 2024. The site features a no-till system with Aksarben silty clay loam soil (fine, smectitic, mesic Typic Argiudolls) as classified by USDA soil taxonomy (Soil Survey Staff et al., 2024). The region has a humid climate, receiving an average annual precipitation of 29.34 inches based on a 30-year average. During the typical summer cover crop season (July–October), the region averages about 11.6 inches of rainfall.
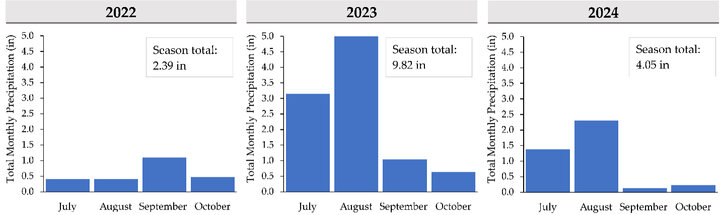
Precipitation data collected from a nearby weather station revealed substantial year-to-year variation. The 2023 season received four times more precipitation than 2022, while 2024 saw nearly double the amount received in 2022 (Figure 1). Overall, total seasonal rainfall in all three years remained below the 30-year average.
The experiment followed a randomized complete block design with 13-15 sole cover crop species (15 in 2022 and 13 in 2023 and 2024) and five mixtures, each replicated four times. Plots were drill-planted following winter wheat harvest, between the second and third week of July. Each plot measured 50 feet long by 15 feet wide. Small-seeded species (millets, sorghum cultivars, buckwheat) were planted at a depth of one inch, while large-seeded species (corn, sunnhemp, cowpea, sunflower, and all mixtures) were planted at a depth of 2 inches. (Table 1). Aboveground biomass was sampled between the first two weeks of October prior to the predicted first frost of the season. All biomass samples were dried, weighed and then sent to a commercial lab to be analyzed for total biomass carbon (C) and nitrogen (N) content.
| Species | Cultivars | Seeding Rate lbs ac-1 |
| Grasses (Goal: forage and high biomass) | ||
| Sorghum Sudan | Queen | 25 |
| Sorghum Sudan | WS902 | 25 |
| Sorghum Sudan | Super sugar | 25 |
| Sorghum Sudan | Tridan* | 25 |
| Sudangrass | Piper | 20 |
| Forage Sorghum | WS404 | 15 |
| Forage Sorghum | Viking | 15 |
| Forage Sorghum | Coes* | 15 |
| Pearl Millet | Tifleaf | 15 |
| Foxtail Millet | German | 20 |
| Corn | BMR grazing | 40 |
| Teff grass | Teff* | 8 |
| Legumes (Goal: Nitrogen fixation and biomass) | ||
| Sunnhemp | Variety not stated (VNS) | 20 |
| Cowpea | Iron and Clay | 50 |
| Broadleaves (Goal: supporting pollinators and deep taproots) | ||
| Buckwheat | Mancan | 35 |
| Sunflower | Black oil | 10 |
| African cabbage | African* | 6 |
| Mixtures | ||
| Simple_Mix (4-species) | Sorghum Sudan (Queen), Sunnhemp, Buckwheat (Mancan), and Sunflower (Black oil). | 23 |
| Grazing_Mix (4-species) | Sudan grass (Piper), Pearl millet (Tifleaf), BMR corn, and Cowpea (Iron). | 33 |
| Soil_Mix (5-species) | Sorghum Sudan (Queen), Forage sorghum (WS404), Sunnhemp, Cowpea (Iron), and Sunflower (Black oil). | 20 |
| Pollinator_Mix (5-species) | Forage sorghum (WS404), Sunnhemp, Cowpea (Iron), Buckwheat (Mancan), and Sunflower (Black oil). | 26
|
| High_Diversity_Mix (10-species) | Sorghum Sudan (Queen), Sudan grass (Piper), Forage sorghum (WS404), Pearl millet (Tifleaf), Foxtail millet (German), BMR corn, Sunnhemp, Cowpea (Iron), Buckwheat (Mancan), and Sunflower (Black oil). | 22 |
*These cover crops were only planted during one experimental year.
Note: In year two, Teff grass and African cabbage were dropped due to germination failure in the first year. Additionally, forage sorghum ‘Coes’ replaced BMR corn, and sorghum-sudangrass ‘Tridan’ replaced ‘WS902’ in year three due to seed availability.
Summer Cover Crop Biomass and C:N Ratio Trends
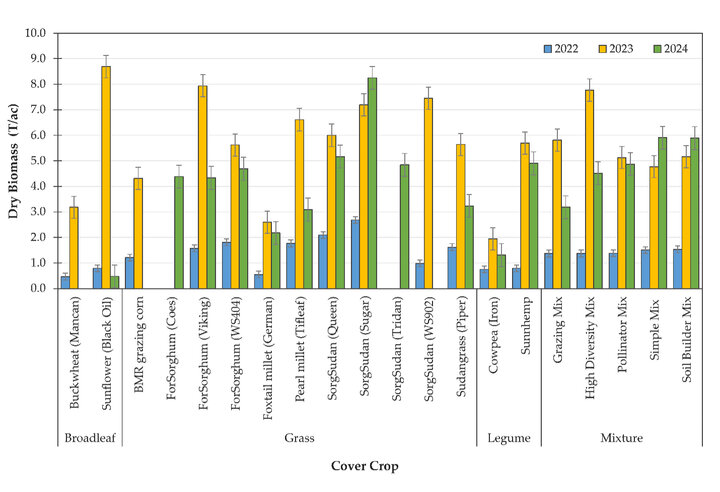
Biomass production varied substantially across the three years, with 2023 being the most productive, likely due to favorable precipitation. Despite weather variability, all species established successfully each year, highlighting the adaptability of summer-planted cover crops under dryland conditions. Top-performing treatments included sorghum-sudangrass varieties (‘Super Sugar’ and ‘Tridan’), forage sorghum ‘Viking’, and the High Diversity Mix. Each averaged ≥4.5 tons/acre of dry biomass across all years, making them strong candidates for maximizing biomass and soil cover.
Grasses
Grasses, as expected, produced higher biomass than other species, increasing from 1.61 tons/acre in 2022 to 5.93 tons/acre in 2023 and remaining relatively high in 2024 (4.36 tons/acre) (Figure 2). Top-performing varieties like sorghum-sudangrass ‘Super Sugar’ and Forage Sorghum ‘Viking’ exceeded 10 tons/acre, while others like ‘Queen’, ‘Tridan’, and ‘WS404’ regularly surpassed 8 tons/acre. Their high C:N ratios (≥51.6) suggest slower residue decomposition, contributing to longer-lasting soil cover. On average, sole grasses contributed 3,589 lbs/acre of carbon (Table 2).
Legumes
Legumes, while lower in biomass, offered valuable nitrogen contributions. Biomass increased from 0.77 tons/acre in 2022 to 3.82 in 2023 and 3.55 in 2024 (Figure 2). Sunnhemp outperformed cowpea, reaching up to 6.29 tons/acre in favorable years. Their low C:N ratios (21–23) promote faster decomposition and nutrient release. On average, legumes contributed 106 lbs/acre of nitrogen (Table 2).
Broadleaf
Broadleaf species showed greater sensitivity to precipitation. Average biomass was low in 2022 (0.63 tons/acre) and 2024 (0.48) but peaked in 2023 (5.93 tons/acre) (Figure 2), largely driven by sunflower (‘Black Oil’), which had the highest overall biomass potential at 12.04 tons/acre and a moderate C:N ratio (37.09). Buckwheat (‘Mancan’) established quickly but produced less biomass (3.35 tons/acre) with a similar C:N ratio (Table 2).
Mixtures
Mixtures offered a strong balance of productivity and nutrient cycling benefits. They produced an average of 1.43 tons/acre in 2022, 5.73 in 2023, and 5.11 in 2024 (Figure 2), with top biomass potential performers like the Simple Mix (9.66 tons/acre), High Diversity Mix (8.70), and Pollinator Mix (8.46). Mixtures averaged 3,591 lbs/acre of carbon and 83 lbs/acre of nitrogen (Table 2), supporting both ground cover and biological activity across a range of conditions.
These results emphasize the importance of species selection and the impact of precipitation on summer cover crop productivity. Grasses deliver high biomass and persistent residue, while legumes and broadleaves support nutrient cycling. Diverse mixtures showed contributions to ground cover, nutrient availability and consistent growth across the range of precipitation conditions at the site over three years, making them a resilient option for building biomass and improving soil health under variable summer rainfall.
| Species | Varieties | C:N ratio | Biomass potential (Tons ac-1) | |
min. | max. | |||
| Grasses | ||||
| Corn | BMR grazing | 45.96 | 0.84 | 5.49 |
| Forage Sorghum | Coes | 72.15 | 3.97 | 5.11 |
| Viking | 58.44 | 0.44 | 10.48 | |
| WS404 | 51.65 | 0.83 | 9.23 | |
| Foxtail millet | German | 45.00 | 0.06 | 3.12 |
| Pearl millet | Tifleaf | 61.87 | 1.09 | 9.14 |
| Sorghum Sudan | Queen | 55.78 | 0.99 | 8.79 |
| Super Sugar | 73.91 | 0.98 | 10.43 | |
| Tridan | 73.00 | 2.06 | 8.02 | |
| WS902 | 44.88 | 0.49 | 7.94 | |
| Sudangrass | Piper | 54.38 | 1.21 | 6.16 |
| Legumes | ||||
| Cowpea | Iron | 21.26 | 0.44 | 2.54 |
| Sunnhemp | VNS | 22.95 | 0.18 | 6.29 |
| Broadleaves | ||||
| Buckwheat | Mancan | 39.41 | 0.30 | 3.35 |
| Sunflower | Black oil | 37.09 | 0.11 | 12.04 |
| Mixtures | ||||
| Grazing Mix | 46.79 | 0.97 | 8.21 | |
| High Diversity Mix | 51.08 | 1.09 | 8.70 | |
| Pollinator Mix | 35.58 | 0.55 | 8.46 | |
| Simple Mix | 50.34 | 0.92 | 9.66 | |
| Soil Builder Mix | 44.72 | 1.16 | 8.34 | |
Lessons Learned
Through this three-year experiment, we observed that the success of non-irrigated summer cover crops is strongly influenced by rainfall during the growing season — particularly during establishment and early growth. Soil moisture availability can be especially limited following wheat harvest, as wheat often depletes much of the available water prior to cover crop planting. Across all three years, rainfall during July and August played a critical role in biomass accumulation, with notable differences in productivity linked to this environmental variability.
The clear year-to-year contrasts highlight how strongly environmental conditions shape cover crop biomass outcomes (Huddell et al. 2024). Because cover crops are not managed like cash crops (i.e., typically they are grown with limited to no external inputs such as irrigation or fertilizer), their productivity is more variable. Their growth is primarily influenced by natural factors such as rainfall, temperature and residual soil nutrients from the previous crop. Despite this variability, consistent trends emerged across the three years, particularly regarding the relative biomass potential of certain species and mixtures under both favorable and adverse conditions.
Including the 2024 season allowed us to evaluate cover crop responses under a broader range of climatic conditions, building on the contrasting precipitation patterns of 2022 (dry) and 2023 (wet). Even in the driest year (2022), most species produced at least 0.8 tons/acre of biomass, reaffirming the adaptive capacity of summer-planted cover crops under water-limited conditions. In wetter summer periods such as 2023 and 2024, several grass species and mixtures exceeded 8 tons/acre, highlighting their high potential when adequate rainfall is available.
With summer droughts projected to increase in frequency and severity across the northern Great Plains (Knapp et al. 2023), the risk of water stress during the critical stages of summer annuals will likely intensify. Introducing cover crops after a cool-season cash crop like wheat may help buffer against this risk by spreading out the critical periods when crops are most dependent on water. It is interesting to note that there was significant drought in the spring of 2023 at our location, limiting winter wheat yields ahead of the summer cover crops that produced the highest biomass (Drought Monitor n.d.).
Moreover, having a living cover in place during late-summer rainfall events can help protect the soil and support biological activity. This strategy may prove increasingly valuable in managing unpredictable weather patterns while maintaining year-round ground cover and promoting long-term soil health (Pathak et al. 2017). It is also important to think in terms of a biomass range, rather than relying on a single-year average, to better anticipate realistic outcomes and manage expectations across variable weather years.
References
- Blanco-Canqui H, Claassen MM, Presley DR. 2012. Summer Cover Crops Fix Nitrogen, Increase Crop Yield, and Improve Soil-Crop Relationships. Agron J. 104(1):137–147. doi:10.2134/agronj2011.0240.
- Conservation Technology Information Center (CTIC). 2020. National Farmer Survey Documents a Wide Range of Cover Crop Benefits as Acreage Continues to Expand https://cropwatch.unl.edu/2020/national-survey-shows-wide-range-cover-crop-benefits-acreage-continues-expand/
- Drought Monitor n.d. https://droughtmonitor.unl.edu/data/png/20230704/20230704_ne_trd.png
- Florence AM, Mcguire AM. 2020. Do diverse cover crop mixtures perform better than monocultures? A systematic review. doi:10.1002/agj2.20340.
- Huddell AM, Thapa R, Marcillo GS, Abendroth LJ, Ackroyd VJ, Armstrong SD, Asmita G, Bagavathiannan M V., Balkcom KS, Basche A, et al. 2024. U.S. cereal rye winter cover crop growth database. Sci Data 2024 111. 11(1):1–7. doi:10.1038/s41597-024-02996-9.
- Knapp CN, Kluck DR, Guntenspergen G, Ahlering MA, Aimone NM, Bamzai-Dodson A, Basche A, Byron RG, Conroy-Ben O, Haggerty MN, et al. 2023. Chapter 25 : Northern Great Plains. Fifth National Climate Assessment. Crimmins AR, Avery CW, Easterling DR, Kunkel KE, Stewart BC, Maycock TK, editors. doi:10.7930/NCA5.2023.CH25.
- Nebraska Department of Natural Resources. NeRaIN - Monthly and annual summary. NeRAIN. [accessed 2025 Mar 26]. https://nednr.nebraska.gov/NeRain/Report/MonthlyAndAnnualSummary/941.
- Pathak P, Kalra A, Ahmad S. 2017. Temperature and precipitation changes in the Midwestern United States: implications for water management. Int J Water Resour Dev. 33(6):1003–1019. doi:10.1080/07900627.2016.1238343.
- Soil Survey Staff, Natural Resources Conservation Service, United States Department of Agriculture. Web Soil Survey. http://websoilsurvey.sc.egov.usda.gov/.
- Wayman S, Cogger C, Benedict C, Burke I, Collins D, Bary A. 2015. The influence of cover crop variety, termination timing and termination method on mulch, weed cover and soil nitrate in reduced-tillage organic systems. Renew Agric Food Syst. 30(5):450–460. doi:10.1017/S1742170514000246.
