Key Takeaways
Faster results — Soil spectroscopy can estimate multiple properties from one scan in minutes instead of days.
More data per field — Lower per-sample cost after startup allows denser sampling and better management zones.
MIR vs. NIR — MIR offers highest accuracy; NIR provides practical, rapid field estimates.
Use alongside lab tests — Keep 5–10% of samples in a certified lab to maintain accuracy.
Soil health insights — One scan can estimate organic carbon, nitrogen, pH and texture.
Carbon monitoring potential — Supports higher-volume soil carbon tracking, though not a replacement for MRV.
Calibration is critical — Models must be adjusted for local soils and instruments.
Know the limits — Nutrients like phosphorus still require traditional lab testing.
Soil testing is on the edge of a major shift — one that could give Nebraska producers faster answers, more data points and better insight into what’s happening across their fields. Instead of waiting days for lab results, new tools using light and machine learning can estimate key soil properties in minutes, opening the door to more responsive and precise management decisions.
Introduction
Over the past several years, research has been conducted to explore methods for testing soils without the use of test tubes or chemical reagents, utilizing light and machine learning to “read” the soil. This approach, called soil spectroscopy, can quickly estimate multiple properties from a single scan, providing a faster, more cost-effective and environmentally friendly alternative to traditional lab tests.
Nebraska’s soils range from the heavy clays of the east to the sandy soils of the Sandhills, making the state an ideal but challenging testing ground for this technology. Thousands of samples collected across the state have been analyzed to evaluate the accuracy and practicality of soil spectroscopy. The results highlight its potential value for Nebraska’s farmers and agronomists in supporting more efficient, data-driven soil management.
How Does Soil Spectroscopy Work?
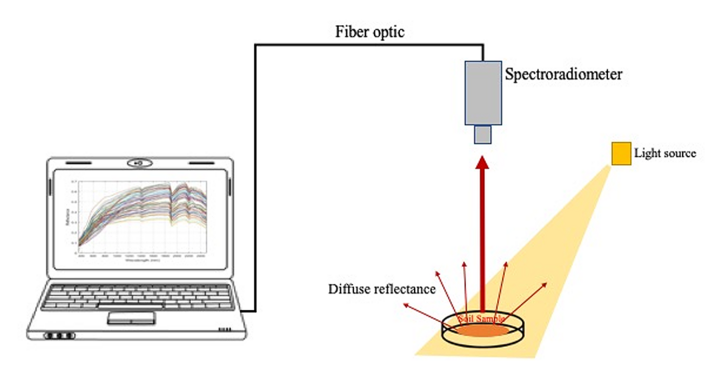
When a beam of light shines on a soil sample, some wavelengths are reflected while others are absorbed. This pattern of reflection is called a spectrum, which acts like a fingerprint that reveals information about what the soil is made of (Nocita et al. 2015). By analyzing this spectrum with a computer, soil properties can be estimated quickly and without chemicals (Figure 1).
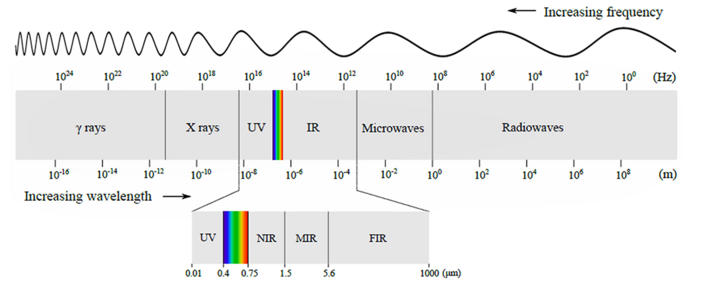
The light used in soil spectroscopy comes from different parts of the electromagnetic spectrum (Sharma 2017), which is the range of energy waves that include visible light, infrared light and other types of radiation (Figure 2). Each region interacts with soil in a slightly different way, revealing unique details about its color, minerals and organic matter.
- Visible-Near Infrared (Vis-NIR), covering a wavelength range of roughly 400-2500 nm, is used in portable and laboratory instruments to detect soil color, organic matter and moisture.
- Near Infrared(NIR) (700-2500 nm) is a narrower part of the spectrum. NIR is widely used in handheld devices for quick field assessments.
- Mid-Infrared (MIR) (~2500-25,000 nm) interacts directly with the chemical bonds in minerals and organic compounds, providing more detailed information and often more accurate predictions of soil properties.
Why Soil Spectroscopy for Agriculture?
Soil spectroscopy is no longer just a research tool; it’s an emerging, practical method for rapid soil analysis. Here’s why it matters for Nebraska producers:
- Spectroscopy can provide results in minutes, as opposed to days or weeks for traditional lab chemistry.
- After the initial equipment investment, each spectral scan is very low cost and no reagents or consumables — just light. This could make routine soil testing much cheaper in the long run.
- No chemicals are needed to extract nutrients for tests, meaning less hazardous waste.
- A single scan can simultaneously predict multiple properties (organic matter, texture, pH, CEC, etc.) rather than running separate lab tests for each.
Soil Health: More Data, Better Decisions
Soil health is more than nutrient supply. It reflects how well soil functions over time, including its ability to cycle nutrients, store water, support biological activity and maintain structure.
One of the most important indicators is soil organic carbon, which is closely tied to broader carbon-based measures of soil health and responds to management practices such as reduced tillage, cover crops, residue retention and organic amendments (Liptzin et al. 2022).
Soil spectroscopy can add value here because it can estimate several properties linked to soil function — including organic carbon, nitrogen, pH and texture — from the same sample. Mid-infrared studies have shown that a single spectrum can be used to estimate many soil properties relevant to carbon storage, nutrient cycling, water storage and habitat function, making spectroscopy a practical tool for tracking key soil health indicators across fields and over time (Ng et al. 2022; Nocita et al. 2015).
From Soil Carbon to Carbon Credits
There is growing interest in soil carbon sequestration and carbon credit programs, especially as producers look to reduce carbon intensity and participate in sustainability markets. These programs require reliable systems to measure and verify changes in soil organic carbon over time. Most follow a framework known as Monitoring, Reporting and Verification (MRV), which ensures that carbon gains are accurately measured, documented and independently verified.
That presents a challenge because changes in soil organic carbon are often small relative to the natural variability within a field, so detecting real change requires careful measurement over time (Nevalainen et al. 2022; Petropoulos et al. 2025).
Soil spectroscopy will not replace formal MRV protocols, but it can make carbon monitoring more scalable. Recent studies show that MIR and compact NIR approaches can support high-throughput measurement of soil carbon and related carbon fractions when they are paired with sound calibration, careful sample preparation, and periodic laboratory validation (Fonseca, Pasquini, and Soares 2023; Ramírez et al. 2021). That makes spectroscopy a promising tool for future carbon sequestration and crediting efforts, especially where programs need more samples, better spatial coverage and lower monitoring costs (Petropoulos et al. 2025).
Turning Spectra Into Soil Insights
The "fingerprints" from the spectrometer don’t directly say “this soil has 3% organic carbon.” Calibration models are needed to translate spectral data into meaningful soil property values.
One of the most widely used approaches in soil spectroscopy is Partial Least Squares Regression (PLSR), which links spectral patterns with measured soil properties. PLSR is a reliable, statistics-based method that identifies relationships between spectral data and soil properties, allowing accurate prediction of soil properties (Zhou et al. 2022).
Previous studies using large soil spectral libraries, such as the Open Soil Spectral Library (OSSL), have shown that these models can successfully estimate key soil properties, including organic carbon, total nitrogen, pH and texture (Partida et al. 2025). Among these approaches, PLSR is a widely used and reliable method, while rule-based models and deep learning approaches provide additional flexibility when sufficient data are available.
Figure 3 illustrates the relationship between laboratory-measured and MIR-PLSR predicted values for soil organic carbon and total nitrogen. The close alignment of points along the 1:1 line indicates strong agreement between measured and predicted values, particularly for organic carbon. Total nitrogen also shows good agreement, although with slightly greater variability.
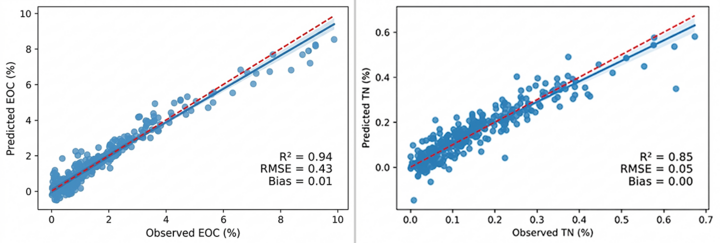
These results highlight that Mid-Infrared (MIR) spectroscopy provides robust predictions for key soil health indicators such as organic carbon and nitrogen. In contrast, some properties, such as phosphorus, are more difficult to estimate due to the lack of a strong direct spectral signal (Hammad 2019). While Vis-NIR and NIR approaches provide moderate performance and practical advantages for field use, MIR is the most accurate method for laboratory-based soil analysis.
Do These Models Work for Nebraska?
A global model is great, but producers in Nebraska need to know: does it work on our soils? Models were trained on national spectral libraries and tested independently on Nebraska samples to evaluate local performance.
With MIR spectra, both PLSR and LSTM (Long Short-Term Memory, a deep-learning approach for modeling sequential data) predicted soil organic carbon (EOC) and total nitrogen (TN) with high accuracy. LSTM performed slightly better when enough data were available.
On the smaller NIR dataset, PLSR maintained moderate accuracy, while the LSTM model struggled. This is not surprising, as advanced AI models typically require large amounts of data to perform well. Vis-NIR results were limited due to the small number of available Nebraska samples.
Overall, MIR is the benchmark for accuracy, while NIR supports rapid soil screening when combined with calibration transfer and periodic lab validation.
Instrument Consistency Across Devices
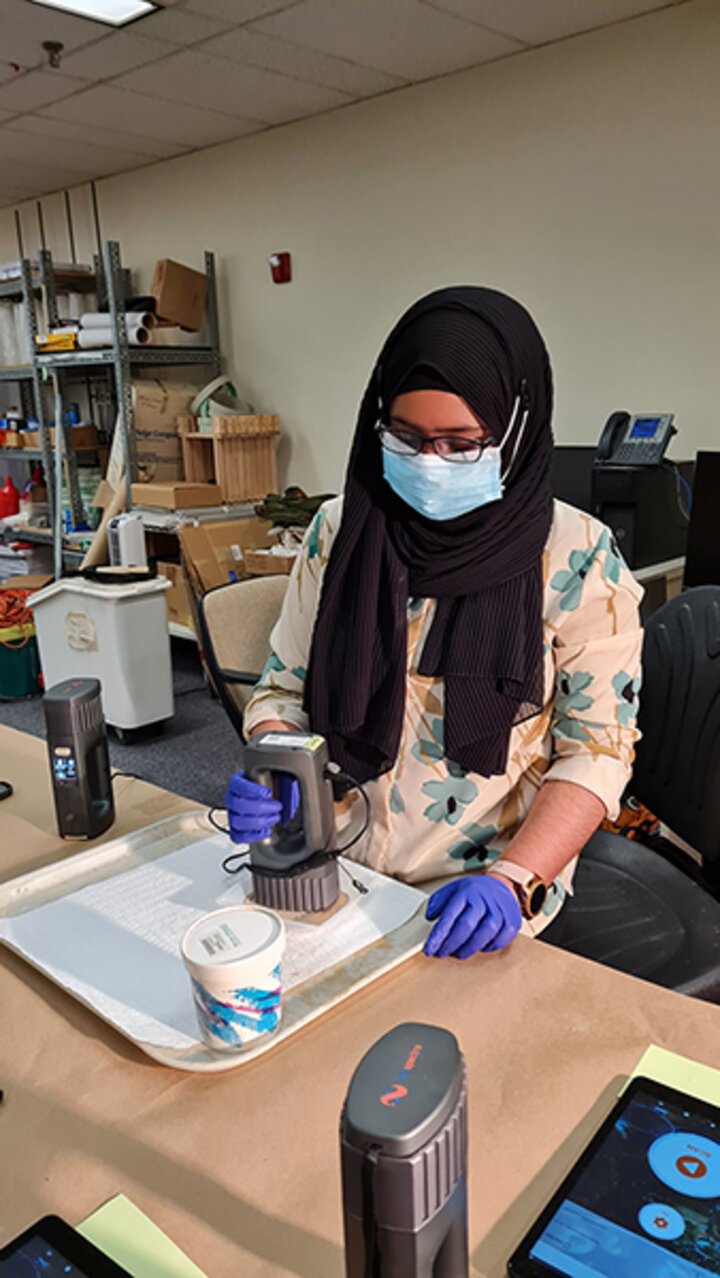
Before we can trust a new technology, we have to test it. To evaluate performance, 600 soil samples from the United States Department of Agriculture Kellogg Soil Survey Laboratory (USDA-KSSL) archive were scanned using five handheld NeoSpectra NIR units (Mitu et al. 2024).
Results showed high spectral consistency across instruments, especially after standard preprocessing. However, when we dug deeper, we noticed that if we tried to use one device’s model on another device’s data, the accuracy could drop a bit. This is a known issue called instrument bias; subtle differences can still affect predictions if not corrected.
Our cross-device assessment suggested that calibration transfer techniques explained in the next section would be needed to maintain the highest accuracy when moving models between devices. These findings support the practical use of handheld sensors in real-world soil labs and field conditions, particularly when supported by transfer techniques to account for minor inter-device variation.
Calibration Transfer Across Platforms
To make advanced lab models more useful on smaller, affordable soil instruments, researchers tested ways to “translate” soil readings between machines. Using 225 soil samples from the USDA-KSSL archive, each sample was scanned on two types of Mid-Infrared (MIR) spectrometers: the Bruker Vertex, a large research-grade system, and the Bruker Alpha II, a compact version that could be used in local or regional labs.
Even though both instruments measure the same kind of light, small hardware differences make their results slightly different. Calibration transfer is like creating a common language between instruments so data from one can be understood by another (Workman Jr 2018). In this study, transfer methods such as Direct Standardization (DS), Piecewise Direct Standardization (PDS), External Parameter Orthogonalization (EPO), and Spectral Space Transformation (SST) helped align the two systems.
Among these, SST provided the most consistent performance across instruments. This means high-quality soil models built on national reference data can potentially be shared with smaller labs and future on-farm devices, making soil testing faster, more affordable and more consistent across Nebraska and beyond.
Implications for Farmers and Managing Expectations
Soil testing is evolving. Instead of mailing samples and waiting days, producers can scan dried soil with a small spectrometer and quickly estimate organic matter, texture, pH and CEC.
Faster results let you adjust rates sooner and make denser, more accurate maps without a big jump in cost per sample. The biggest win is mapping variability — instead of one lab sample for 40 acres, you can collect about 20 spectral readings for about the same cost, then use those data to build management zones for variable-rate (VRA) nitrogen and seeding based on what’s actually changing across your fields.
Maintaining 5–10% of samples for lab validation each year to verify accuracy and catch drift.
This technology has incredible potential, but we need to be realistic about the hurdles. Here is a summary of the common barriers and the research-based solutions we are working on.
| Barrier | What It Looks Like on Farm | Practical Fix |
|---|---|---|
| Moisture sensitivity | Wet samples give inflated or jumpy readings | Dry consistently, then scan; note moisture status. |
| Device-to-device differences | Readings vary by device | Normalize, smooth, then apply an alignment/calibration so outputs match closely. |
| Small local calibration | Works on one soil, fails on another | Grow your library: save spectra with lab results; pool across seasons/fields. |
Property limits (phosphorus, potassium) | Low R²; unstable predictions | Keep lab tests for extract-based nutrients |
| Unclear workflow | Not sure who scans, when or how | Write a simple Standard Operating Procedure: drying, sieving, number of scans, schedule |
| Model drift over time | Accuracy slips after software/firmware changes | Do quarterly lab check-ups, recalibrate when needed. |
Conclusion
Soil spectroscopy, combined with machine learning, represents a significant step forward in how we assess soil health and fertility. This research, undertaken with guidance from University of Nebraska-Lincoln Biological Systems Engineering Professor Yufeng Ge, demonstrates that we can predict key soil properties like organic carbon and clay content with high accuracy.
MIR spectroscopy provides the highest precision, while portable NIR devices are easier to use and still deliver good, practical accuracy. The ultimate vision is empowering Nebraska’s producers with real-time soil data, enabling smarter decisions that improve productivity and sustainability.
The journey from lab research to on-farm application is underway, and the results are very encouraging. As this technology continues to develop, Nebraska’s agricultural community can look forward to more informed soil management without the traditional delays and costs. In essence, we’re adding a new tool to precision agriculture — one that uses a beam of light to unlock the secrets beneath our feet.
References
- Fonseca, Aymbiré A, Celio Pasquini, and Emanuelle. M B Soares. 2023. “Large-Scale Measurement of Soil Organic Carbon Using Compact near-Infrared Spectrophotometers: Effect of Soil Sample Preparation and the Use of Local Modelling.” Environmental Science: Advances 2(10): 1372–81. doi:10.1039/D3VA00046J.
- Liptzin, Daniel, Charlotte E Norris, Shannon B Cappellazzi, G Mac Bean, Michael Cope, Kelsey L H Greub, Elizabeth L Rieke, et al. 2022. “An Evaluation of Carbon Indicators of Soil Health in Long-Term Agricultural Experiments.” Soil Biology and Biochemistry 172: 108708. doi:https://doi.org/10.1016/j.soilbio.2022.108708.
- Mitu, Sadia M, Colleen Smith, Jonathan Sanderman, Richard R Ferguson, Keith Shepherd, and Yufeng Ge. 2024. “Evaluating Consistency across Multiple NeoSpectra (Compact Fourier Transform Near‐infrared) Spectrometers for Estimating Common Soil Properties.” Soil Science Society of America Journal 88(4): 1324–39.
- Nevalainen, O, O Niemitalo, I Fer, A Juntunen, T Mattila, O Koskela, J Kukkamäki, et al. 2022. “Towards Agricultural Soil Carbon Monitoring, Reporting, and Verification through the Field Observatory Network (FiON).” Geosci. Instrum. Method. Data Syst. 11(1): 93–109. doi:10.5194/gi-11-93-2022.
- Ng, Wartini, Budiman Minasny, Sang Ho Jeon, and Alex McBratney. 2022. “Mid-Infrared Spectroscopy for Accurate Measurement of an Extensive Set of Soil Properties for Assessing Soil Functions.” Soil Security 6: 100043. doi:https://doi.org/10.1016/j.soisec.2022.100043.
- Nocita, Marco, Antoine Stevens, Bas van Wesemael, Matt Aitkenhead, Martin Bachmann, Bernard Barthès, Eyal Ben Dor, et al. 2015. “Soil Spectroscopy: An Alternative to Wet Chemistry for Soil Monitoring.” Advances in agronomy 132: 139–59.
- Partida, Colleen, Jose Lucas Safanelli, Sadia Mannan Mitu, Mohammad Omar Faruk Murad, Yufeng Ge, Richard Ferguson, Keith Shepherd, and Jonathan Sanderman. 2025. “Building a Near-Infrared (NIR) Soil Spectral Dataset and Predictive Machine Learning Models Using a Handheld NIR Spectrophotometer.” Data in Brief 58: 111229. doi:https://doi.org/10.1016/j.dib.2024.111229.
- Petropoulos, Theodoros, Lefteris Benos, Patrizia Busato, George Kyriakarakos, Dimitrios Kateris, Dimitrios Aidonis, and Dionysis Bochtis. 2025. “Soil Organic Carbon Assessment for Carbon Farming: A Review.” Agriculture 15(5): 567. doi:10.3390/agriculture15050567.
- Ramírez, Paulina B, Francisco J Calderón, Michelle Haddix, Emanuele Lugato, and M Francesca Cotrufo. 2021. “Using Diffuse Reflectance Spectroscopy as a High Throughput Method for Quantifying Soil C and N and Their Distribution in Particulate and Mineral-Associated Organic Matter Fractions.” Frontiers in Environmental Science Volume 9-2021. doi:10.3389/fenvs.2021.634472.
- Sharma, R K. 2017. “Various Spectroscopic Techniques.” Environmental Pollution: Monitoring Modelling and Control; Studium Press, LLC: Houston, TX, USA: 181–206.
- Wadoux, Alexandre M J -C., Brendan Malone, Budiman Minasny, Mario Fajardo, and Alex B McBratney. 2021. “Introduction BT - Soil Spectral Inference with R: Analysing Digital Soil Spectra Using the R Programming Environment.” In eds. Alexandre M.J.-C. Wadoux, Brendan Malone, Budiman Minasny, Mario Fajardo, and Alex B McBratney. Cham: Springer International Publishing, 1–10. doi:10.1007/978-3-030-64896-1_1.
- Workman Jr, Jerome J. 2018. “A Review of Calibration Transfer Practices and Instrument Differences in Spectroscopy.” Applied Spectroscopy 72(3): 340–65.
- Zhou, Peng, Kenneth A Sudduth, Kristen S Veum, and Minzan Li. 2022. “Extraction of Reflectance Spectra Features for Estimation of Surface, Subsurface, and Profile Soil Properties.” Computers and Electronics in Agriculture 196: 106845.
