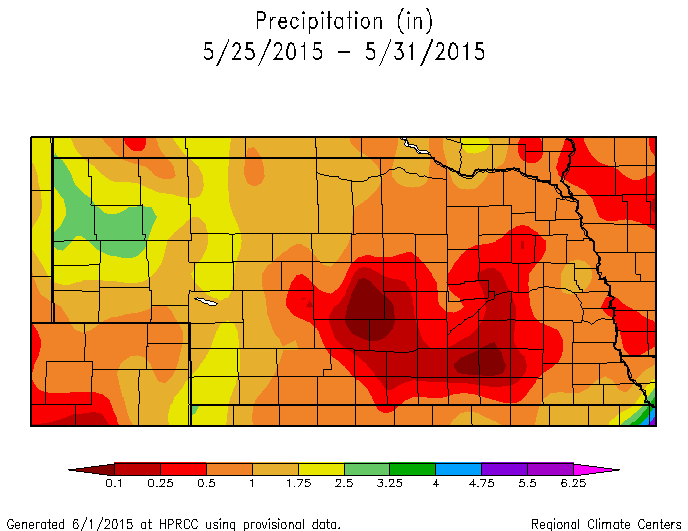
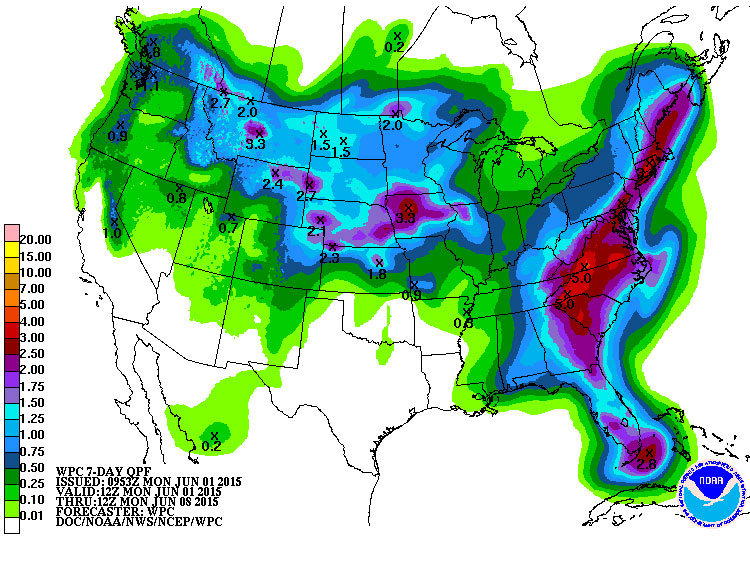
Figure 1 (left) Precipitation from May 25-31, 2015. (Source: High Plains Regional Climate Center). Figure 2 (right) Precipitation predicted for June 1-8, 2015. (Source: Weather Prediction Center). Both link to larger versions.
Western Nebraska Soil Moisture Profile Still Full
June 2, 2015
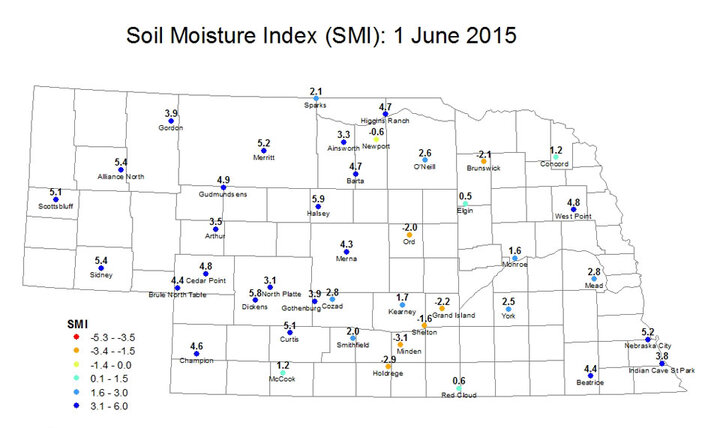
There were few changes to the map in the last week with the dry areas remaining dry and the moist areas remaining moist to reaching near saturation levels. Here's a quick roundup by region:
- Panhandle/Sandhills: An additional two inches of rain fell over the past week at several locations and Soil Moisture Index (SMI) values remain over 5.0 at several of these sites (Scottsbluff, Alliance, Sidney, Merritt, Halsey, and Dickens), indicating soils are close to saturation.
- Eastern: An additional one-half inch to an inch fell across southeastern Nebraska where SMI values are above 3.0, with a value of 5.2 at Nebraska City. Soil moisture is still sufficiently high at most other eastern sites but generally not at the levels seen back in the first half of May when rainfall was more excessive.
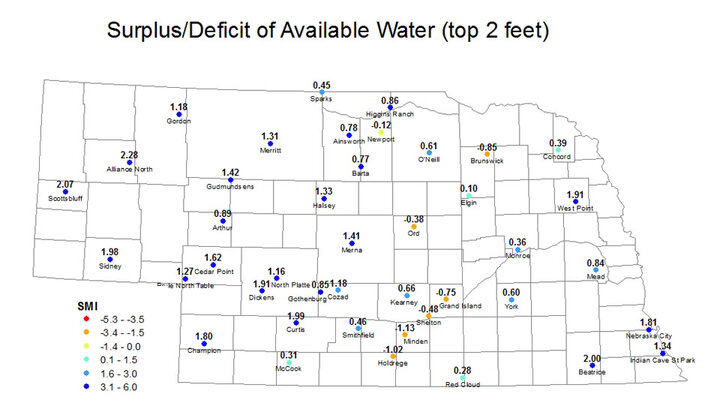
- Central: Much of central Nebraska received under one-half inch of precipitation and soils remain fairly dry in the area roughly bounded by Highway 281 to the west and Highway 14 to the east. Minden is this week's loser yet again, with an SMI of -3.1 and a soil moisture deficit of over one inch in the top two feet of soil.
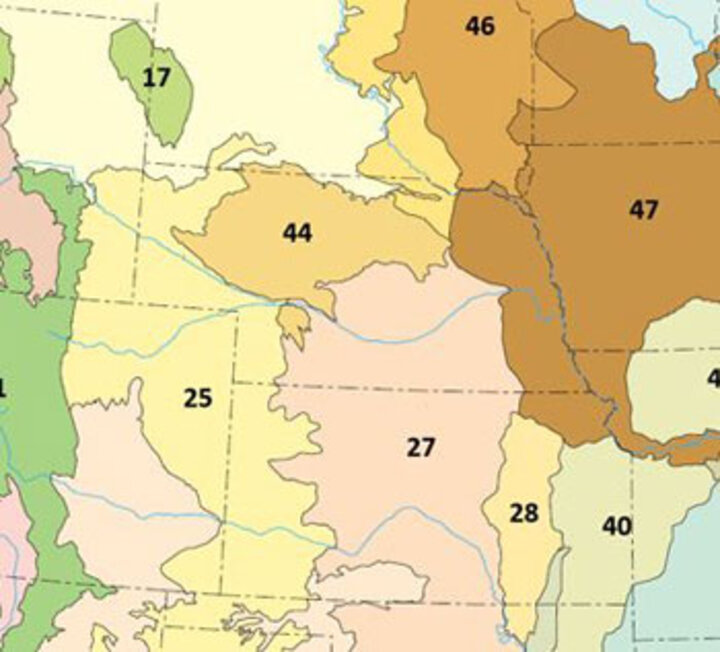
Average SMI by Level 3 Ecoregions in Nebraska. (Averages include areas outside Nebraska.)
- Central Great Plains (Map 27): 1.0
- Western High Plains (Map 25 ): 4.8
- Northwestern Great Plains (Map 43): 3.4
- Nebraska Sand Hills (Map 46): 2.9
- Western Corn Belt Plains (Map 47): 3.7
The Soil Moisture Index (SMI) is based on the estimated field capacity and wilting point at three depths (10 cm, 25 cm, 50 cm) at Automated Weather Data Network (AWDN) sites under grass cover. The index may not necessarily be representative of conditions of a nearby field, particularly if differences in total precipitation over the previous week have been significant.
Eric Hunt
High Plains Regional Climate Center